Usually we have to apply a greater effort, amount of money, etc, to get more of something. However when it comes to lossy compression systems and audio quality we expect to turn this upside-down. With formats like MP3, Ogg, or AAC we expect a higher bitrate to reduce the unwanted changes in the details of the sound due to the encode-decode processes. More bits per second should deliver less in the way of audible changes. So it wasn’t a surprise that listener reaction was very enthusiastic when the BBC provided an experimental 320k stream of the Proms. But how much ‘better’ was the result?
In a previous article on the experimental 320k stream I focussed on timing issues and the effects of computer clock mismatches, resampling, and data transfer delays. Here I want to try answering two simple questions. How closely did the streamed audio waveforms match the input LPCM that the BBC were wishing to broadcast? And how did 320k compare with the 192k rate that was the standard for Radio 3 at the time of the experiment?
To answer these questions in an objective way I chose the Cross Correlation approach that I outlined in the earlier article. Having identified the required time-alignments I used correlation to obtain values in some ways akin to the traditional ‘distortion’ usually given as a percentage. In the “More is Less” spirit I did this by saying that where the correlation between two versions of a recording was, say, 0·99, then the difference between them was 0·01 – i.e. 1%. I could then say that there was an ‘Error’ and give it a percentage value. When comparing a source version (input to the BBC system) with the stream output this meant that that 1% of the waveform shape wasn’t as in the source. As with conventional distortion this gave me a percentage value where ‘lower error’ meant ‘‘better fidelity’. However – unlike distortion – this difference may be due to some details of the source waveform going AWOL!
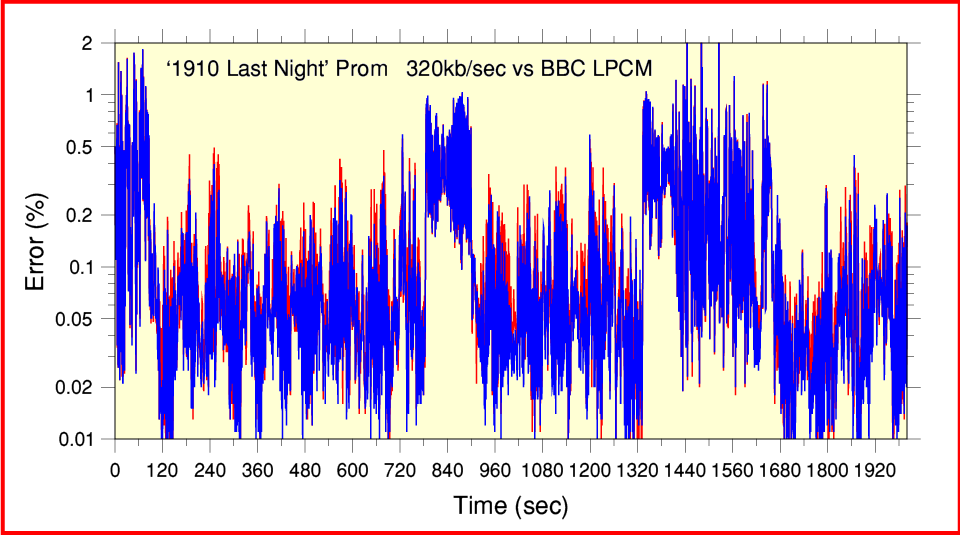
Figure 1 Error Levels for 1910 Last Night Prom (320k stream vs LPCM
Figure 1 shows how the correlated error level varied during a 2000 second section of the ‘1910 Last Night’ Prom. (This is the same section as I examined in the previous article on relative time offsets and clock behaviour.) It shows how much what I received using my home computer differed from an LPCM version provided by the BBC. Looking at this graph you can see that for a lot of the time the Error (i.e the amount by which the versions differ) is below 0·2%. At such times it generally tends to be around 0·05%. If this were traditional nonlinear distortion we’d be likely to conclude that it was low enough to be practically inaudible. So it is a good result on that basis. In practice, of course, the ‘error’ for lossy encoding systems like AAC tends to consist of a mixture of
- The complete removal of some spectral components which were assessed as being ‘below the audibility threshold’ by the encoder.
- Slight adjustments in the amplitudes of the included spectral components as a result of their amplitude values being requantised.
- Alterations in the relative phasing of components for similar reasons.
- The use of Spectral Band Replication to reduce the data required to provide ‘harmonics’ which might otherwise be lost.
As a consequence, the alterations are designed to elude being audible and may consist of details that are omitted. Whereas ye olde nonlinear analogue distortion tends to add unwanted spectral components, and thus tends to be more noticeable. Taking these differences into account we can suspect that when the alterations are below about 0·5% they may well be completely unnoticeable to a listener. Particularly one who can’t do repeated A-B comparisons with an unaffected source version! Hence the results do support the reaction of listeners that the stream sounded very good.
A snag is that the above only considers the bulk of the time where the Error level is low. Some of the time it can clearly be seen to rise above 0·5%, and occasionally rises above 1%. This may still not be particularly audible. But given experience that analogue nonlinear distortion of this size would be audible it is worth considering why the Error level becomes this high at times.
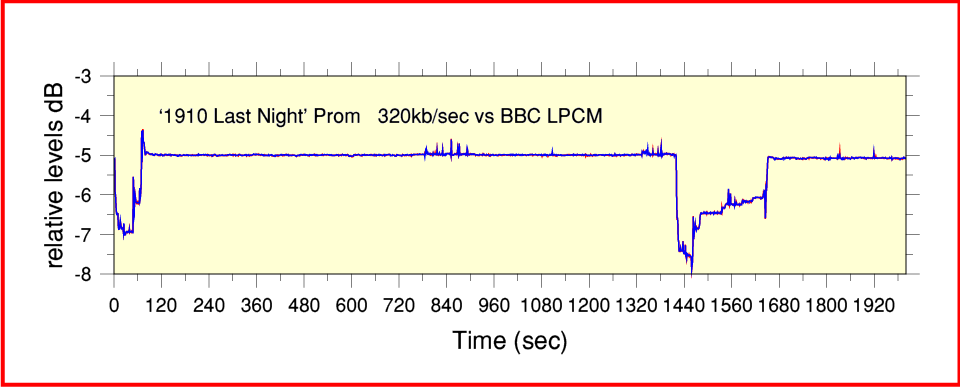
Figure 2 iPlayer chain relative levels for 1910 Prom.
A clue to one possible reason for this behaviour can be seen in Figure 2. This shows a plot of the relative mean power levels of the BBC LPCM and my recorded stream. (My recordings were all made using the Flash Plugin volume set to the ‘Spinal Tap 11’ and then taking an optical SPDIF output to avoid other level adjustments.) Figure 2 essentially shows the gain of the Coyopa - browser plugin chain. You can see that most of the time the output I recorded had a level that was about 5dB higher than the source LPCM the BBC provided for me to examine. However sometimes (e.g. from around 1400 to 1600 seconds from the start) the gain was varying and tended to change by a few dB. This indicates that some form of level adjustment or alteration was changing the received mean level during transmission. And it was at these times that the Error level was relatively high. To understand what is happening we can use the results shown in Figure 3. Here the upper plot shows how the peak audio level varies with time during the 320kb/sec iPlayer stream I recorded. The lower plot shows how it varied in the BBC LPCM version that represents the input to Coyopa.
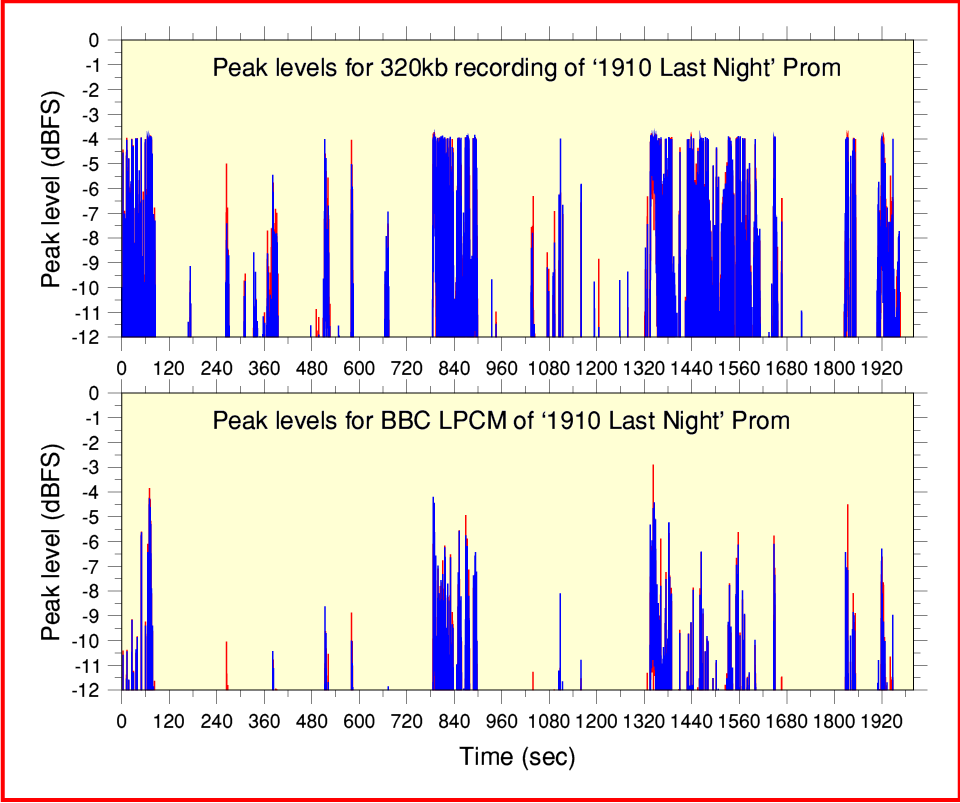
Figure 3 Peak audio levels for both versions of the ‘1910 Last Night’
Bear in mind that these values are not directly comparable with the ones in Figure 2 for two reasons. Firstly they are instantaneous peaks, not time averaged mean powers. Secondly, the values shown in Figure 3 are for each successive 0·1 second whereas the results in Figure 2 are averages over each 1 second section of the audio. However two facts are obvious. Firstly – as already established from Figure 2 – the output level from the iPlayer was typically about 5dB louder. Secondly, the peaks shown in the LPCM version are being clipped or ‘gain dipped’ in the 320k stream version.
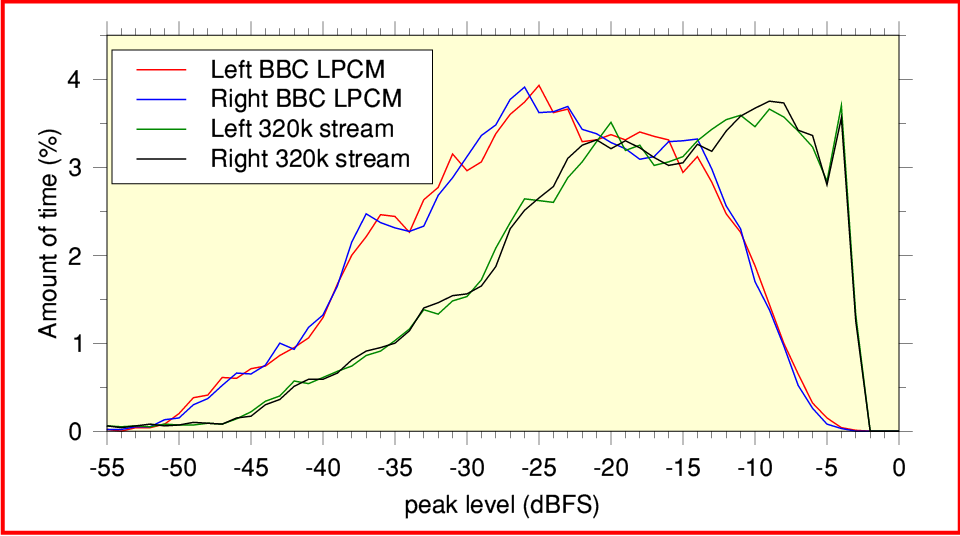
Figure 4 Probability distributions for the peaks levels of the ‘1910 Last Night’
Figure 4 displays the results of examining the peak dynamics of the recordings. In this case the results are for portions of the recordings lasting 80 mins (4800 seconds). These plots show what percentage of the time the audio reached a given peak level. By comparing the LPCM and 320k stream plots you can clearly see that the received 320k stream has had its level increased and is clipping or limiting. (This is shown by the way the high-level end of the distribution is squashed up against -4dBFS.) So the iPlayer 320k stream output during the ‘1910 Prom’ was having its level boosted by around 5dB by the Coyopa system. The result was then being limited to a maximum of about -4dBFS. This limiting was a behaviour I’d also observed during the 2009 Proms, and may of course have some audible effect, although I can’t say I heard the clipping at the time.
From the results in Figures 1-4 it seems plausible that at least some of the rise in Error that occurs during louder passages of music may not be due to the AAC encoding and decoding as such. It may arise because brief peaks in the audio waveforms are being modified to avoid other problems. This is a shame as it may have tended to mask or discard some of the advantage of having the high stream bitrate! I did discuss these results with the BBC and my understanding is that they initially encountered some difficulties with optimising the gain level and avoiding limiting. However they did work on the problem, and the situation improved during later Proms, as subsequent measurements showed...
Having examined the 1910 Prom, I also looked at the set of recordings of the Prom on the 9th of September 2010 that the BBC had kindly sent to me.
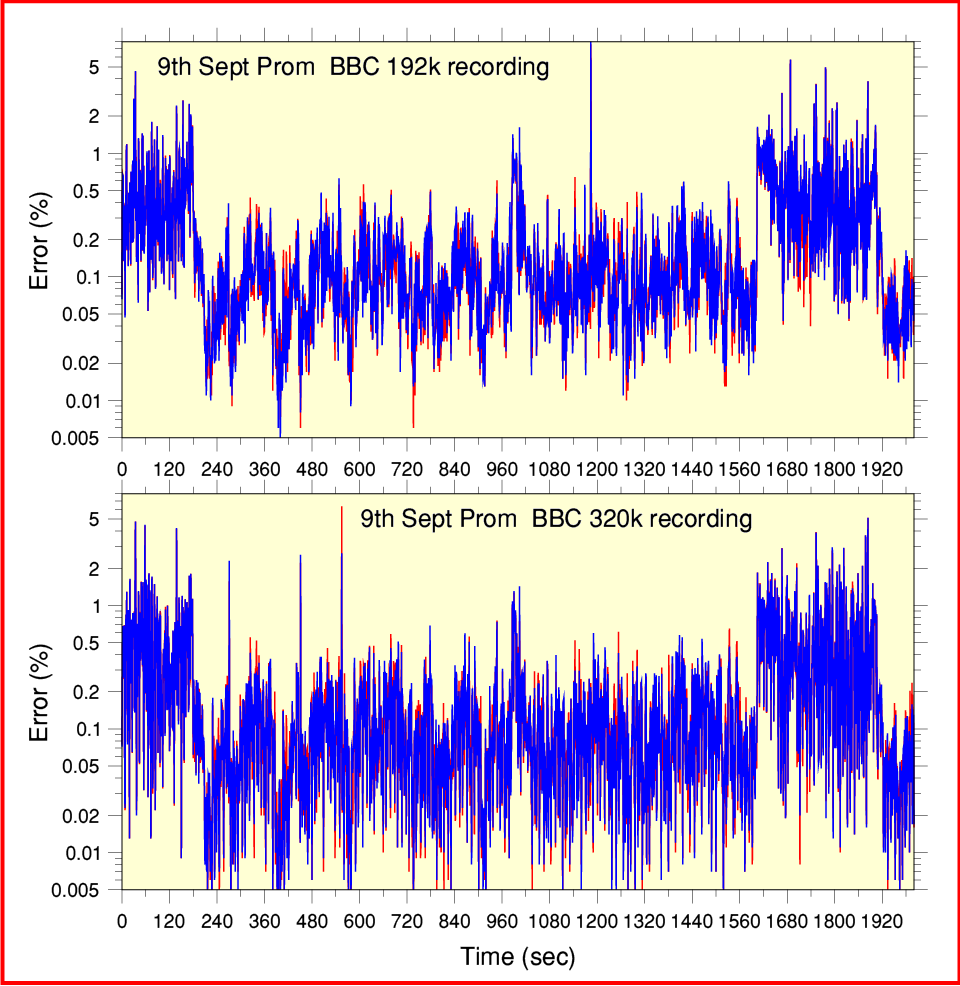
Figure 5 Error behaviours for 192k and 320k streams of the same performance.
Figure 5 shows how the Error levels vary with time for 192k and 320k stream recordings of the first 2000 seconds of the Shubert/Schumann Prom on the 9th of September 2010. It is hard to compare the plots in Figure 5 by eye because the actual Error level fluctuates so much. But there is a distinct tendency for the 320k stream to be able to reach down to lower Error values than the 192k stream. This gives the 320k plot a more ’stretched down to low levels’ appearance than the 192k plot. i.e. The 320k stream spends more of the time below 0·02%, say, than the 192k stream.
A number of isolated brief rises in the Error are visible in Figure 5. These seem to occur at the moments when there are jumps in the correlation timing. So they may be due to the timing effects discussed in the previous article. As such they probably aren’t due to the encode-decode process. More likely to be due to clocking/jitter errors or internet transfer delays.
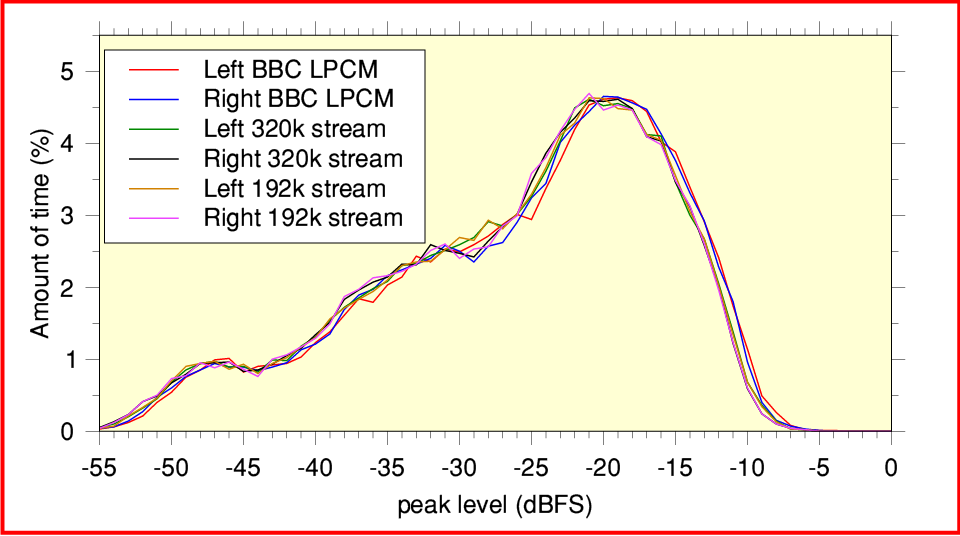
Figure 6 Probability distributions for 9th September 2010 Prom
Figure 6 shows the peak level distributions for the BBC source LPCM, 320k, and 192k stream versions. For this Prom the encoder-decoder chain gain was close to 0dB during the performance. The plots show very similar shapes with no sign of any added clipping/limiting. There are some slight differences in the overall gain but not enough to have any obvious significance. The results seem much better than the 1910 Last Night Prom. So the evidence indicates that by the 9th of September the BBC had corrected the tendency of the 320k stream output to be at a high gain level, and were avoiding the limiting that had affected earlier broadcasts.
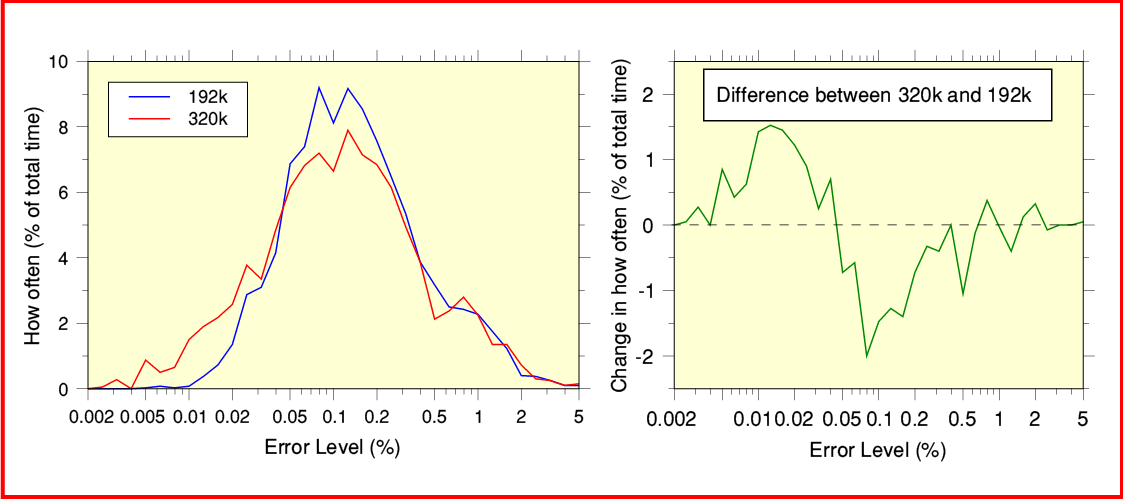
Figure 7 Probability distributions for the 192k and 320k Error values.
To get a clearer view we can examine the results in terms of how often a given Error level arises in each case. Figure 7 shows the relative amounts of time each stream output has a given Error value. (For the sake of simplicity I’ve combined the Right and Left channel results.) Looking at this you can see that above 0·5% Error both the streams tend to produce a given amount of Error about equally often. However below 0·5% there is a noticeable difference. Here the 320k stream results give very low Error values (below about 0·04%) distinctly more often than the 192k stream. Whereas the 192k stream tend to more often give an Error above 0·05%. This does indicate that overall the 320k tends to give a more faithful representation of the source waveforms than the 192k stream. In particular it is interesting that Error levels of 0·5% or more tend to occur when the music is loud. This may mean that the benefit of choosing 320k rather than 192k is more marked when the music isn’t too loud!
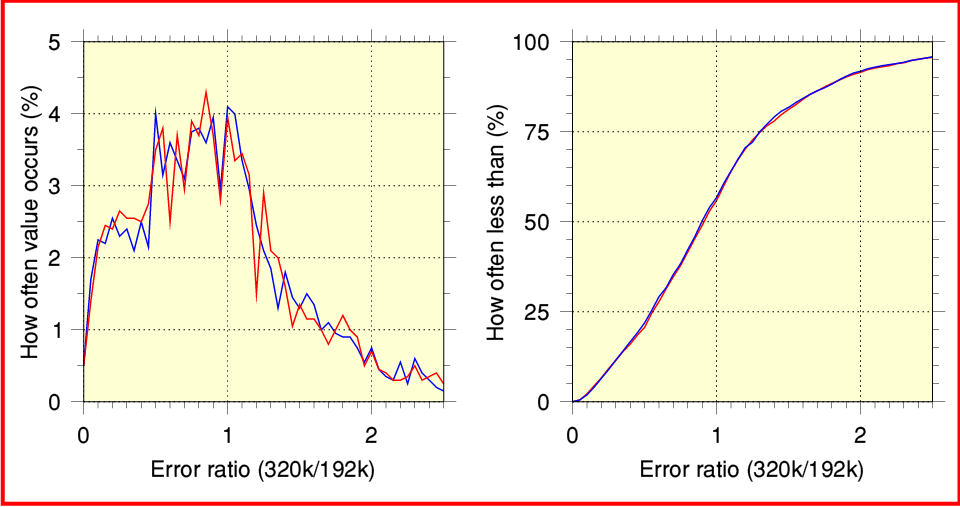
An alternative way to assess this is shown in Figure 8. Here I took each 1-second section of the music and calculated the ratio of the Error levels for the two iPlayer streams. I then added up how often a given Error(320k)/Error(192k) ratio occurred. Note that when we get a ratio of less than ‘1’ it means that the Error for the 320k stream was lower than for the 192k stream. (i.e. the 320k stream was a more accurate representation of the original waveform.) Whereas when a 1-second section gives a ratio above ‘1’ it means the 320k stream was less accurate than the 192k stream.
Figure 8 section-by-section relative Error for 9th September streams
The graph on the left in Figure 8 shows how often each ratio occurred. Looking at this we can clearly see that the most likely results for any 1-second section tend to be a ratio in the range from about 0·5 to 1. i.e. we are most likely to get a value in this range and may mean that the Error has been reduced – perhaps to a half of its 192k value.
That looks like a clear ‘win’ for the 320k stream. However we need to interpret the graph with care. This is because we have a ‘320k win’ range of 0 - 1, whereas the 192k stream ‘wins’ (gives lower Error) for any value from above ‘1’ up to infinity! What we really want to know is, “How often is the ratio less than one?” The graph on the right of Figure 8 answers this question. This accumulates all the occurrences of a given Error ratio up to each value in turn. Looking at this graph we can see two things. Firstly, that the ratio is less than ‘1’ for about 55% of the time. i.e. For more than half the time the 320k stream Error is lower than for the 192k stream. Hence, as we might hope, the 320k ‘wins’ overall! The second result is that about 50% of the time the ratio is no more than 0·9. So although we may often do as well as to halve the Error, in general the improvement is more modest.
One interesting feature of the results for the 9th September Prom is that they do seem to share with the ‘1910 Last Night’ a tendency for the prolonged loud sections of the music to cause higher amounts of Error. With the ‘1910 Last Night’ that may well in part be due to limiting. But this does not seem to be the case on the 9th September. At present it isn’t clear to me if the rise in Error is simply associated with a high sound level, or with some other factor affecting the waveform like the spectrum or waveform shapes. One possible cause is what engineers call ‘Crest Factor’. This means the difference between the peak level and the mean level during a given period of time. A simple sinewave (tone with only one frequency component) has a crest factor value of 3dB because its peaks briefly have twice the waveform’s average power.
Waveforms that have many frequency components, or whose loudness varies rapidly with time tend to have crest factor values much bigger than 3dB. As a rule, the more complicated and quickly varying the details of the sound, the larger the crest factor value will be. Hence it is a measure of the ‘complexity’ of the sound waveform that the encoder-decoder have to try and accurately convey.
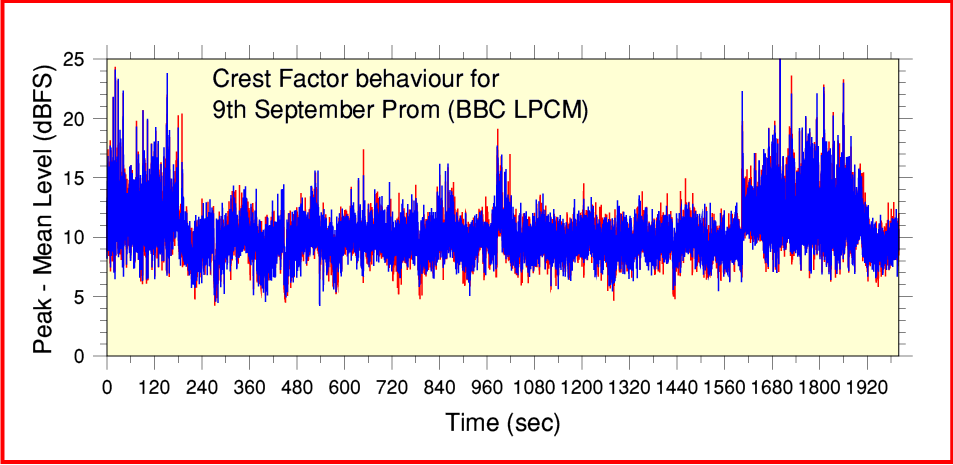
Figure 9 Crest Factor results for the 9th September 2010 Prom
Figure 9 shows how the crest factor varies during the 2000 second section of the 9th September Prom. If you compare this with the Error results (Figure 5) you can see that the crest factor does, indeed, seem to increase during the sections of the music which also have a high Error level. Hence the rises in encode-decode error might well be due to the complexity of the waveforms, not simply the fact that they are louder! This makes sense because the AAC encoding is then struggling to represent the waveforms with a limited set of data. The more complex and quickly varying the waveform, the more information we’d need to convey all the details.
Of course, the Errors here are not the same as traditional nonlinear distortion. Hence we can’t easily transfer these measured results into subjective impressions. For example, the nature of the Error may differ from one bitrate to another. Some changes may be due to the removal of spectral components, others due to slight alterations in their amplitudes. These may affect the sound differently to, say, changes in relative phases of spectral components or the use of Spectral Band Replication (a method that tries to reinsert ‘missing’ harmonics). We would expect increasing the bitrate to allow the result to provide improved fidelity. But the devil may lay in the detail.
The results also depend on how the encoder makes use of the added data to provide useful information. The settings and use of the encoder (and decoder) matter. So we might also find that the 320k stream sounds ‘better’ than the 192k stream even when they have the same measured Error level. The 320k encoding may be able to make a better use of the information at its disposal to avoid the Error being so audible. It is also worth noting that the results I obtained are clearly affected by timing drifts, jitter, and pauses. When you listen using an imperfect home computer setup and broadband connection these effects may be masking some of the improvements that changing from 192k to 320k has the potential to provide. Indeed, your computer or ISP may be struggling harder to work with 320k than 192k! Taking all these factors into account it may well be that the real potential of the 320k stream will only become apparent when a number of other practical factors are optimised.
During the 320k ‘XHQ’ test the BBC clearly worked on their arrangements for setting the stream's gain and clipping/limiting levels. This showed up in the improvement in the 9th Sept Prom. And they have continued to work on this. So it looks likely that clipping or limiting will be much rarer in future. The BBC are obviously determined to provide the best possible sound quality for the 320k streams in the future.
Overall, the experiment – and the later announcement that the BBC will start making the 320k stream permanently available as an ‘HD Sound’ stream for Radio 3 and other events – were excellent news for audio enthusiasts. The results during the test sounded very good, and the change seems worthwhile. During the test I found the sound quality to be superb. Quite frankly I tend to find that the established 192k iPlayer stream for Radio 3 also sounds excellent. So in a sense the points I raise are perhaps almost academic. And the statistically modest improvement in the measured results when going from 192k to 320k may simply be a reflection of how good the 192k stream is in the first place!
In honesty, if I ignore all the analysis the only thing which really detracted from my enjoyment was the occasional gap (pause). And that may be a matter for my broadband service provider, not the BBC. So roll on December!
I’d like to thank the people at the BBC who gave me a great deal of help and advice during my investigations into the iPlayer stream behaviour. As you might expect, Time Lords prefer to remain anonymous. But their help allowed me to do a much fuller examination than would otherwise have been possible. The results, as well as their willingness to help, clearly show how keen they are to deliver excellent sound.
Jim Lesurf
3200 Words
8th Nov 2010