2. Simple example using 75 Ohm coax cable as interconnect.
For the sake of example we can define some reasonable ‘standard’ conditions and then explore the effects of altering some of these conditions to assess their probable effects upon performance. The choice of a standard is at this point fairly arbitrary, but a reasonable set of initial assumptions are as follows:
- A standard cable length of 2·5 metres
- Copper as the conductor material
- Inner conductor diameter of 0·1 to 1mm
- Capacitance of 50-150 pF/metre, or a nominal characteristic impedance of 50 or 75 Ohms.
- Use of air-PTFE as dielectric spacer. (i.e. epsilon between about 1 and 2).
before proceeding it is worth noting that typical domestic audio interconnects are often only around 1 metre long, hence any cable effects these exhibit are likely to be less than we may see that when considering lengths of 2·5 metres.
To start detailed consideration we can begin with a specific example; cable with a 1mm diameter inner, a 75 Ohm nominal characteristic impedance, and an insulator whose effective epsilon value is 1·5. We can also choose an outer conductor whose thickness is 0·2mm, a source resistance of 600 Ohms, and a load resistance of 25 kOhms. This set of values can then be used for future calculations except where otherwise indicated. It is worth noting that many signal sources will have a resistance lower than 600 Ohms, and many inputs will have an input resistance above 25 kOhms. As with the choice of a cable length of 2·5 metres these values are chosen on the basis of being a “reasonably plausible worst case” for the purposes of looking for unwanted amplitude or time effects.
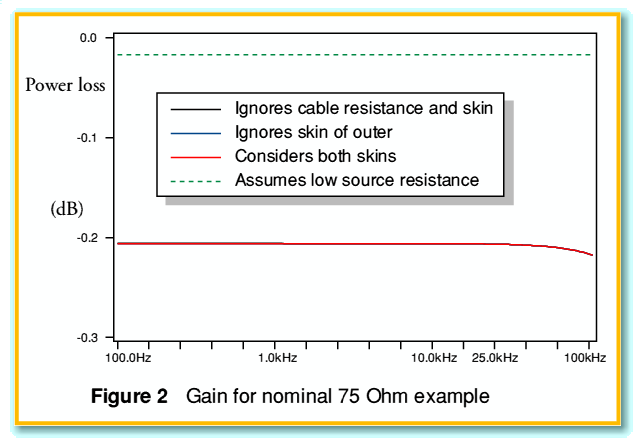
Figure 2 illustrates the gain-frequency plot we obtain for this source/cable/load combination. The figure actually shows four distinct plots. The black solid line shows the gain we could expect if the cable had an internal impedance of zero (i.e. no ‘skin effect’ at all) and the cable resistance were zero. The blue line includes the effect of the wire resistance but only takes the internal impedance of the inner conductor of the co-ax into account and ignores the internal impedance of the outer conductor (shield). The red line takes into account the internal impedances of both the inner and outer conductors. Hence the red line fully allows for any effect due to “skin effect” and cable resistance. All the plots, of course, take the co-ax nominal capacitance and inductance into account.
In fact, when we look at Figure 2 we can see that the three solid lines are essentially overlaid. This indicates that any effects due to the internal impedances of the wires are very small. The final plot (shown as a green broken line) assumes the same cable, takes internal impedances, etc, into account, but assumes a lower source impedance value of 50 Ohms rather than the 600 Ohms assumed for the other plots.
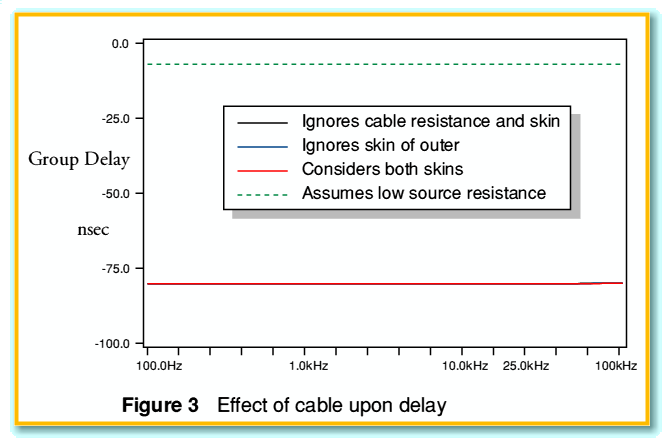
By comparing all four plots we can draw some general conclusions about the situation modelled. It seems that the behaviour of the source-cable-load interaction is dominated by two effects. Firstly, we can see that the actual signal loss is almost perfectly uniform over the audio band. In the case of the 600 Ohm source the loss is around 0·206 dB. In the case of the 50 Ohm source it is 0·0174 dB. These values fit very well with the attenuation we would expect from a 600 Ohm/ 25 kOhm potential divider (0·206 dB) and a 50 Ohm / 25 kOhm one (0·0173). As a result we can conclude that the loss is dominated by the source and load, not the cable. The second effect can also be illustrated by looking at the time delay plots for the same set of four conditions as shown in Figure 3.
The implication of Figure 3 is similar to that of figure 2. Namely that the effects of the internal impedances of the wires are so small in this example as to be virtually unnoticable. The delay values are almost uniform across the audio band, at 80 nanoseconds for the 600 Ohm source examples, and 6·8 nanoseconds for the 50 Ohm source. Since the cable is far from being matched to the source and load impedances and is short we can treat it very simply as either an RC delay or an L/R delay due to the lumped element filtering action.
For the example cable we have  and
and  . Using the cable capacitance and a source resistance of 600 Ohms we obtain a value for the time constant
  of 81 nanoseconds, and with a 50 Ohm source we obtain a time constant value of 6·8 nanoseconds. This indicates that the cable delay is essentially due to the interaction of the cable capacitance with the source resistance. Since the load impedance is far higher than both that of the source and the characteristic impedance of the cable we can expect the signal current level to be very small. Hence the delay and loss effect of the cable inductance and load resistance is extremely small.
The above results may well not apply to all types of co-axial cable. However they indicate that the second general result will tend to be that any signal delays – and hence phase shifts – will tend to be dominated by the combination of the source impedance and cable capacitance. This implies that by keeping the product of the cable capacitance and source resistance low we should be able to obtain low levels of dispersion and uniform loss across the audio band. However this may not be the case when the cable is long, or when the load impedance is not relatively high and entirely resistive.