A USB Audio test bench
During the last decade or so I’ve noticed the rapid expansion in the use of USB Audio as the route used when people wish to play or capture audio. This allows the user to bypass the – often lousy quality – internal ‘soundcards’ on computers, and hence get better results. For those interested in High Fidelity this has led to a number of outstandingly capable DACs (Digital to Analogue Convertors). These – when fed with good quality high resolution material – can deliver superb sound quality. In addition it is now fairly common for items like new ‘Turntables’ for playing ‘Vinyls’ to have a USB output. As a result, USB Audio ADCs (Analogue to Digital Convertors) have become increasingly common as the route by which musicians, studios, and home users capture audio.
I’ve used examples of both types of device for some years, but the appearance of a new library of computer code for the RISC OS computers I tend to prefer prompted me to wonder how well even modest priced devices might work. So I decided to write some software and find out. As a result, I have become quite impressed by what is now possible in terms of audio quality, even when using budget-priced equipment. To me it now looks like even a simple home audio system can be used to obtain measured results that match that of a bench full of expensive specialist lab/reviewer kit! Which in turn is very promising for those who simply want to play or capture good stereo sound quality.
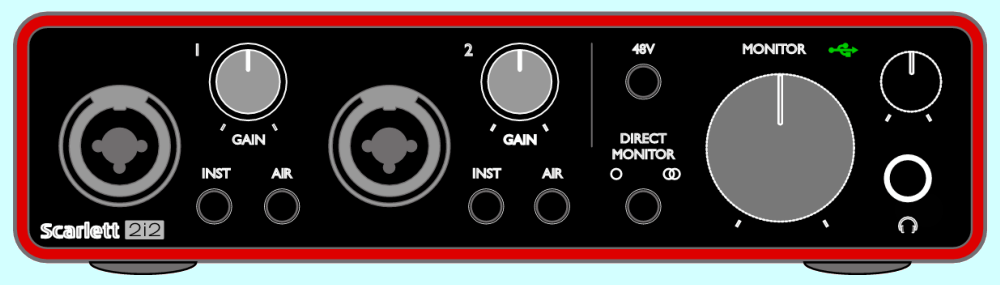
Some years ago I bought a Focusrite Scarlett 2i2 USB ADC+DAC and found that it worked quite nicely. However since then things have moved on and the current “3rd Generation” version of the 2i2 offers an improved specification. It has become one of the most popular examples of this kind of device. So I decided to get one and use it as the basis of my investigation.
One particular advance is that the 3rd Gen version can operate at higher sample rates than the original. i.e. it can handle 192k/24bit in contrast to the maximum of 92k/24bit which limits the original. However an apparent snag I initially encountered was that the makers essentially present a “Windows only” attitude. This extends to insisting that the 2i2 will only fully work if you install their software. Which isn’t available for Linux or RISC OS. Yet some searching on the web showed me that it seemed to work OK with Linux. I contacted Focusrite and asked about this because there would be no point in buying one if it then refused to work as required with the systems I use. (I keep telling people, “My house has no Windows”... but I can’t say “No apples” though, because I have some in a bowl!)
Focusrite replied, telling me that there was a ‘magic trick’ I could perform. This was to hold down one of the buttons on the front panel as the unit was powered up, and that would enable the device to work, but that not all functions would be available if I didn’t use an operating system that would run their software. This did make me hesitate, but in the end I decided to buy one and find out.
Purely out of curiosity when the 2i2 came I decided to give it a try without having performed the magic trick – and discovered that it worked just fine ‘out of the box’! So I haven’t bothered with the magic trick and have just got on with using it. In this state the 2i2 also shows a small internal storage area and I can read the files this holds. One of which also contains the warning about it being vital to install the downloadable Focusrite software. I can only wonder why because I’ve not bothered. However I noticed that one of the identifiers the 2i2 provides when queried via USB looks like a unique ‘serial number’. So I wonder if this means installing the Focusrite software allows them to identify who is using each of their devices. I have tried to find out more about their policy, but haven’t had a reply. So I can only speculate about that, and move on to the performance.
To test this I wrote some new software which allows my computer to act as a combination of an oscilloscope, spectrum analyser, signal measurement kit, and a signal generator. It lets me simultaneously send test waveforms out via USB to the DAC and capture input via USB from the ADC. I can choose to use the 2i2 for both tasks, or employ a separate USB DAC to generate a test waveform which produces a response that can be fed back into the ADC. This let me assess the performance of the units involved, including any in the path from DAC output to ADC input. I called the program I wrote for this purpose !USBScopePlus.
(Click on the image for a larger, clearer, and more detailed view.)
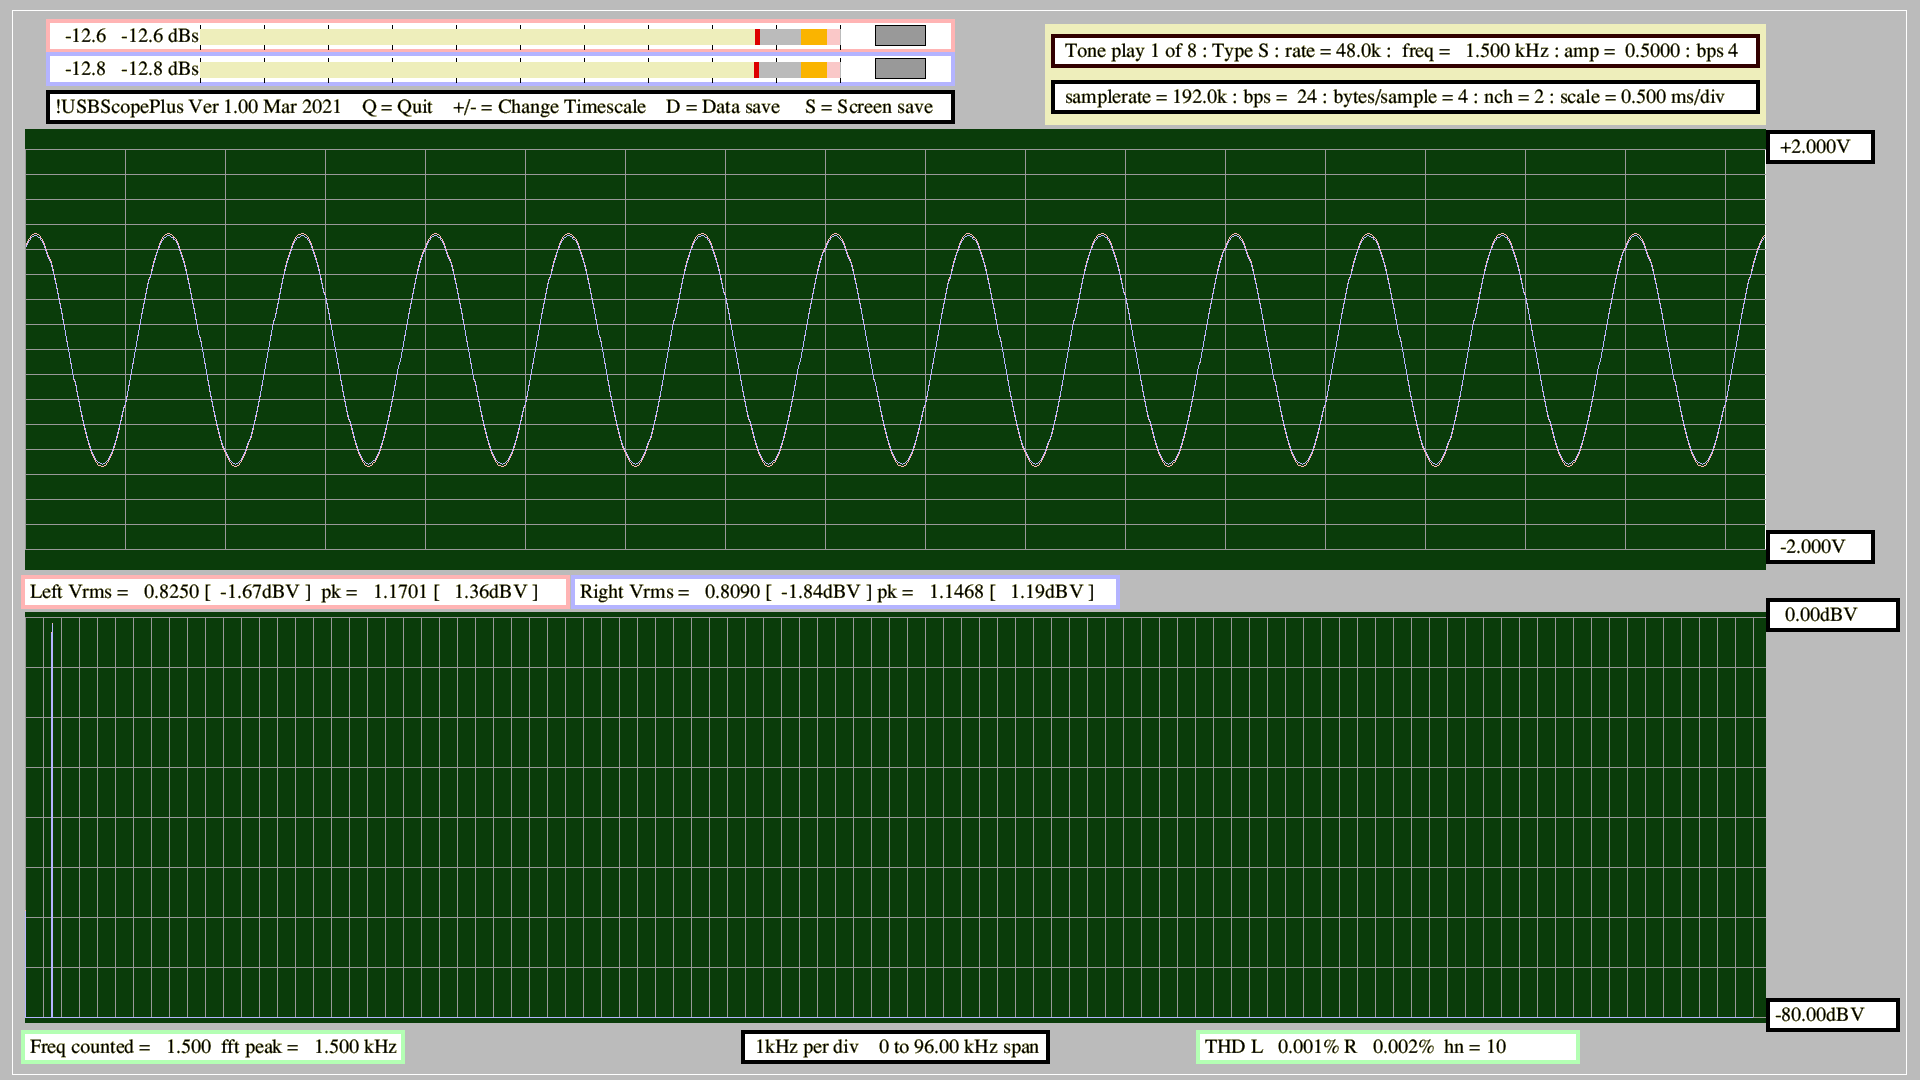
Figure 1 above displays a typical result as shown by a screengrab of what appears on-screen. In this case the program was using a Cambridge Audio DAC Magic Plus as the DAC to output audio signal waveforms and the Focusrite 2i2 3rd Gen as the ADC to capture that output. (This was actually via a small stepped attenuator I built to let me vary the signal levels for initial tests.) The results show that the combination can deliver clean results with low levels of distortion, etc. The measured total noise floor was more than 90 dB below peak level for an (unweighted) 24kHz measurement bandwidth. When using separate units for the DAC and ADC the program can get them to run at different sample rates. This can be convenient when looking for ‘out of band’ problems arising from DAC imperfections. However when using the same device as both DAC and ADC the device may tie its input and output rates together. Hence it can be more flexible to use distinct devices.
As can be seen above, the program acts as an Oscilloscope. It also carries out an FFT and displays the spectrum, finds the largest frequency component, and calculates the total harmonic distortion of a nominal sinewave of that frequency. It also calculates a frequency based on a zero-crossings count which can give a more accurate result for some waveforms. PPM (Peak Programme Meter) displays also show how close to clipping the ADC input may be. The program can also save a set of files which list the then-current results obtained for further analysis/examination as may be required.
In addition to a simple sinewave the tone generation process provides various other forms of wave. These include a squarewave, dual-tone waves for intermodulation distortion checks, and Gaussian Noise. The user can choose/alter the amplitudes and frequencies as relevant to suit their preferences. It also offers a set of waveforms based upon the Impulse function. These are particularly useful for testing DACs and looking for phase dispersion or clipping/slewing rate problems. Also useful for assessing the performance of a loudspeaker/room combination. One of the selectable waveforms can be ‘user defined’. i.e. the user can specify the series of sample values that define the shape of the waveform.
For the sake of illustration of the various possible applications I’ll chose a personal favourite which I called the “Wave From Hell!” (WFH) because it represents a serious ‘torture test’ for devices like ADCs and DACs in particular. This is my own current ‘user defined’ waveform which is supplied with the program as an example.
The WFH is designed to test the ability of a DAC to cope with ‘inter-sample overs’. These occur when a series of samples defines a waveform that rises – between samples – to levels that are outside the range of any actual possible individual sample value. These can arise with real music recordings, so need to be coped with to avoid a form of clipping distortion. However this problem is rarely considered.
Note that the following waveforms are plots of real, measured signals. To obtain them I used !USBScopePlus to play out the series of samples which defines the waveform via a DAC Magic Plus and simultaneously capture the DAC’s output using the Focusrite 2i2 3rd Gen as an ADC. For the tests I ran the DAC Magic Plus at 48k sample rate and the 2i2 at 192k sample rate (thus giving more detail to the captured waveform shape).
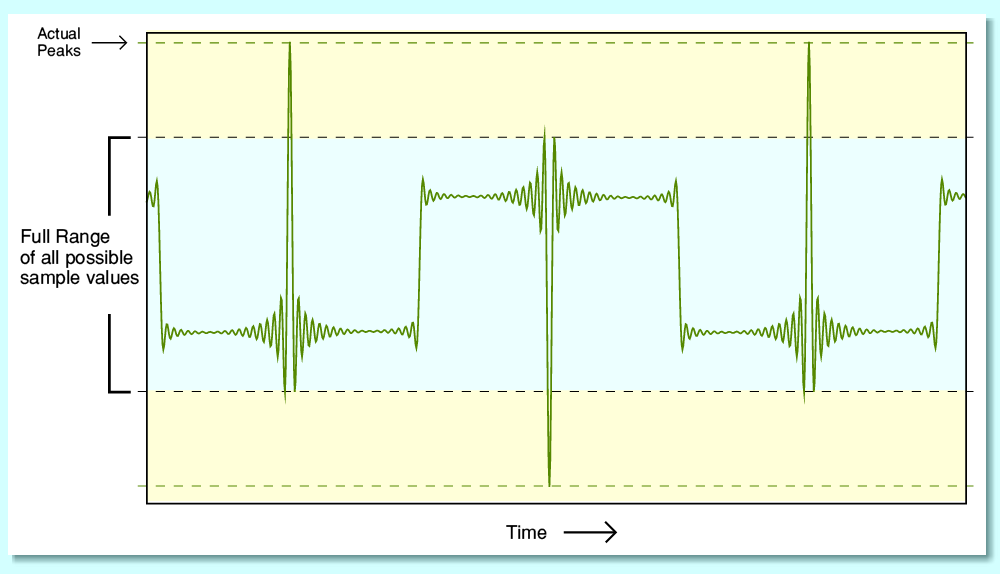
Fig 2 - The Waveform From Hell.
The WFH consists of a series of sample values designed to generate the maximum possible peak value I could arrange between a pair of sampled points during each cycle. The DAC Magic Plus has an output gain control. In practice I carried out some initial tests with a scaled down version of the waveform that ensured these peaks were all within the range of sample values. ( I also ensured that the input level to the 2i2’s ADC was always well below its clipping point.) The above illustration shows the measured results when using the DAC Magic with its output level turned down by about 6dB to ensure its actual output remained within the standard full range of digital values. For the sake of the illustration I have then scaled up the result to the size which a perfect DAC would produce when playing the output at full gain, preserving the same waveform shape.
The waveform that results is essentially as it should be, and shows the WFH characteristic of spikes that extend way above the normally assumed maximum range, as a series of “inter-sample overs” during each half-cycle of the waveform. However...
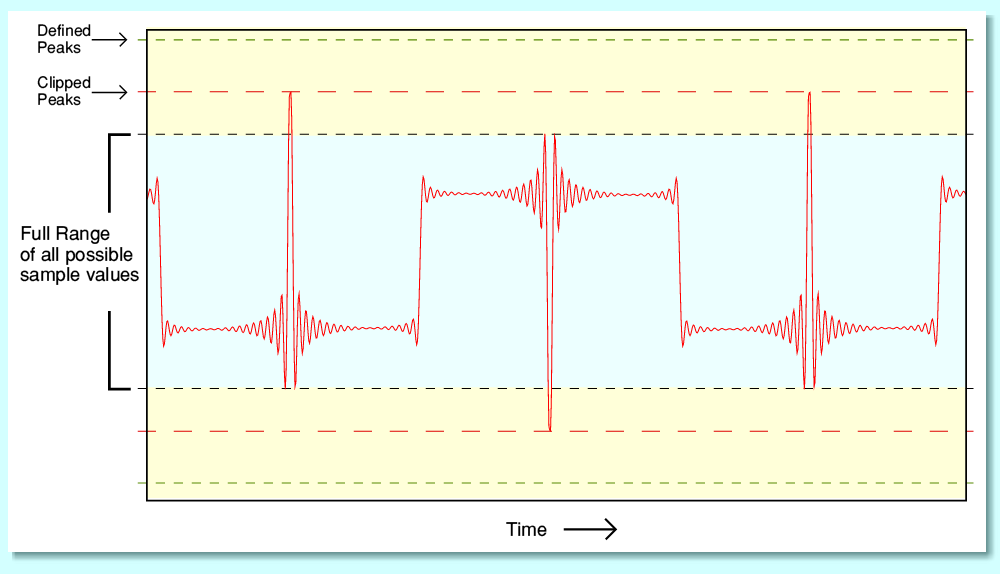
Fig3 - Clipped!
The above illustration now shows the output when I wound up the gain of the DAC Magic Plus to its full level. Overall, the shape is almost the same as before. But we can see that the peaks are clipped off. They do extend beyond the nominal maximum sample range, but not to the extent that they should. As a result, the peaks become distorted.
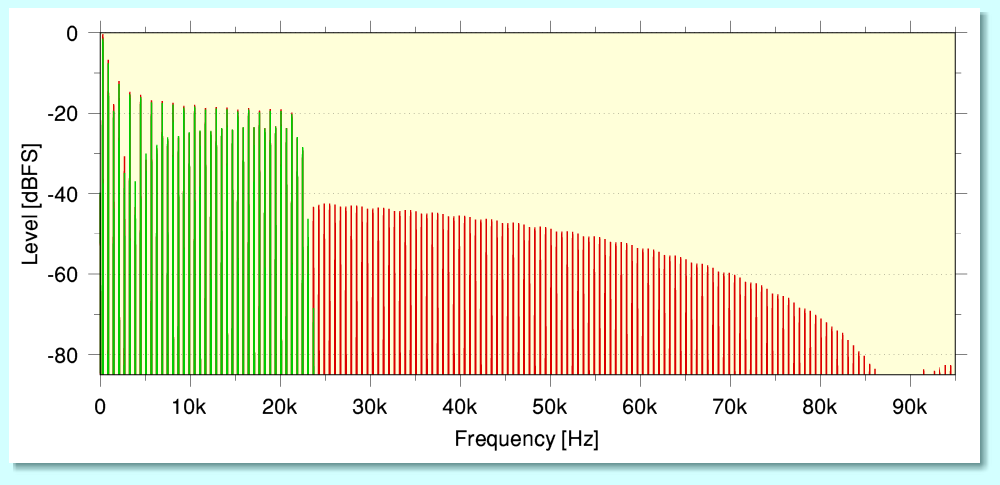
Fig 4 - Spectra of the two versions
The above shows how the spectra of the clipped and unclipped WFH differ. The unclipped version comes from the DAC Magic Plus fed a signal with a 48k sample rate. As a result the output should not contain anything above 24kHz. The unclipped (green) plot therefore only contains components limited to this region and indicates that in that case the DAC was working well. However the clipped (red) output displays a large number of components above 24kHz, This shows that the clipping is an abrupt nonlinearity that essentially snips off the peaks! That said, the DAC does allow the output to rise by a modest amount over the nominal maximum sample level range, so the clipping isn’t as bad as it might be! And the good news is that if we turn down the gain set by the volume control on the front of the DAC Magic Plus it does not clip the WFH output. So the potential problem can be avoided simply by the user knowing to avoid having the output level set very high. And to be fair, the WFH is an extreme case which is likely to be far more demanding than most ‘intersample overs’ on digital recordings of real music. Hence, although I could provoke the clipping, in careful normal use the DAC wouldn’t clip. Ideally, though, it would not clip even when the DAC’s volume control was wound up to the maximum.
The above measurement is an example of when it is useful to have the capture (ADC) run at a high sample rate. (In this case 192k samples/sec.) This allows us to find the components above 24 kHz, and see the flattened peaks. However in other situations it may be better to have the ADC run at the same rate as the DAC. This helps exclude more HF noise from the measurement / observation process. It also allows the FFT to provide a higher resolution as well as a lower noise floor for the spectra it outputs.
Having experimented with various USB Audio devices the results indicate that they – used with software like !USBScopePlus – can provide test-bench/lab standard results if used with suitable care. Decades ago I needed an array of expensive test and measurement kit to assess the performance of something like an audio amplifier I was developing or checking. Some of that kit was very expensive. However now it seems that much of that kit can be replaced by a good USB ADC + DAC and suitable open-source software at a lower cost. A situation that should benefit many who may wish to test, fix, or improve domestic audio equipment.
The results are also good news for anyone wanting to use a modest-priced USB ADC+DAC like the 2i2 as it shows that remarkably good recording quality can be obtained with them when used with due care, etc. They may have not had the ‘Hi Fi credentials’ of the USB DACs used by serious audiophiles, but they work well, nevertheless. It is a pity, though, that Focusrite’s stance on informing potential users is so, erm, strange. About the only criticism I can make of the 2i2 is that I feel that the input level controls are awkwardly small and fiddly. This makes them hard to set with the high accuracy I want for precision measurements. However they are probably fine for their intended uses recording music or speech.
Anyone who wishes can find a copy of !USBScopePlus, and some related software, via my software page at http://www.audiomisc.co.uk/software/index.html . Currently the program I have provided only runs on the RISC OS operating system. But I do plan to make a Linux version at some future point. And my source code is available for anyone else who wishes to produce a similar program for use on other operating systems.
More information on the WFM and why I dreamed it up can be found here:
http://www.audiomisc.co.uk/HFN/OverTheTop/OTT.html
Jim Lesurf
30th Mar 2021