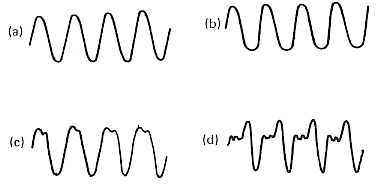
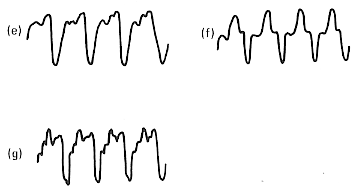
The waveforms produced by musical instruments (and the human voice) are often significantly polarity (sign) asymmetric. This fact tends to be overlooked in some texts which describe the sounds in terms of power-frequency spectra without noting that the phase relationship between harmonics may lead to quite specific, and asymmetric, waveforms. Many texts do show representations of waveforms. As an example, the two images shown below were taken from scans of pages 12 and 13 of Newnes Audio and HiFi Engineers Pocketbook by Capel.
In the above:
(a) Glockenspiel
(b) soft Piano
(c) loud Piano
(d) Trumpet
The loud Piano and the Trumpet waveforms can be seen to be asymmetric, the effect being more obvious on Trumpet.
In the above:
(e) French Horn
(f) Clarinet
(g) Violin
Here the waveforms produced by the French Horn and Violin can clearly be seen to be asymmetric. it is worth noting that the shapes, and degree of asymmetry depend upon the note being played, how loudly, and the placement of the microphone. The above waveforms are typical, but not definitive. For example, although as shown here the Clarinet waveform looks fairly symmetric, this will not always be the case. In general, most musical instruments will show asymmetry on some notes on many occasions. The literature shows this is true even for instruments like the flute which is known for its ‘purity’ of tonal colour.
Detailed Trumpet Example.
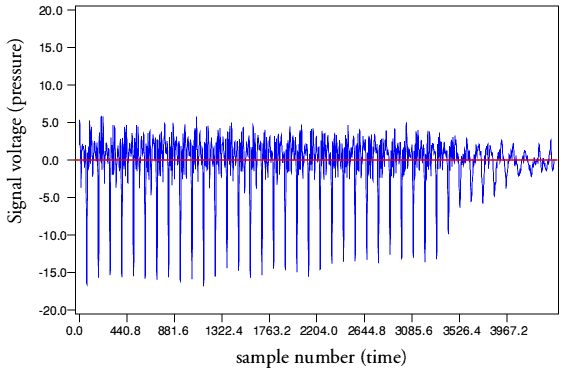
The above images suffer a little from being scans of what seem to be drawings traced over waveforms which were probably obtained via photographs of oscilloscope traces. This means they lack details and may not be accurate. The zero levels are also omitted, and the waves are only shown for a few cycles. To obtain a more precise view I wrote a program that allowed me to read through and display the waveforms recorded on commercial CDs. This allowed me to produce the more detailed graphs shown below
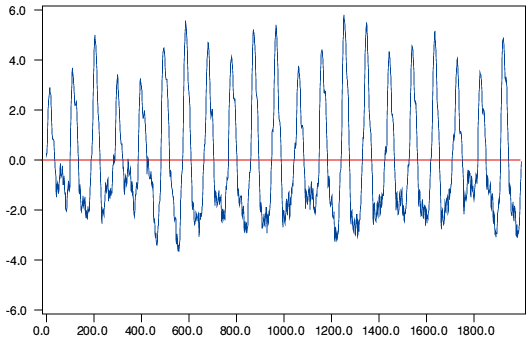
The above shows one channel of a snippet from “So What” (Kind of Blue, Miles Davis, CD 460603 2) It was taken from a sustained note on the trumpet. The portion chosen shows the sustained note and the moment when the trumpeter ceases to blow. Viewing earlier portions of the note show the same sustained pattern as is seen here.
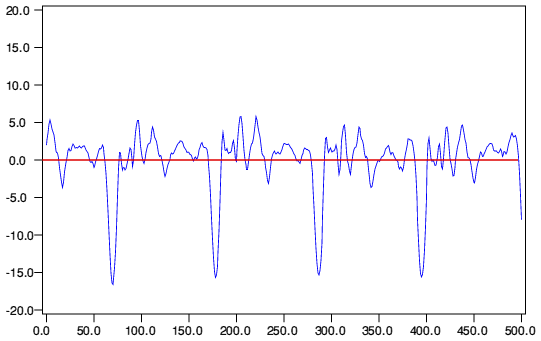
For clarity, the above image zooms in on a few cycles taken from the start of the chosen section. This shows fewer cycles of waveform, but the repeating shape is clearer, and can easily be seen to by highly asymmetric with negative peak amplitude excursions which are around three times the magnitude of the peak positive amplitude excursions.
The specific trumpet track and CD were chosen for the purposes of clarity as it provides a fairly sparse arrangement. However similarly asymmetric patterns are common - indeed may be statistically more common that symmetric ones - on most musical recordings. In each of the above examples a red line is used to highlight the zero level where the pressure equals the ambient unmodulated value.
Specific Violin Example
As a second example, we can use a recording of a violin solo.
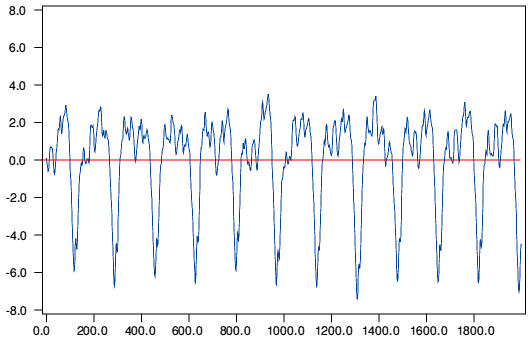
The above shows a waveform taken from the body of a sustained violin note. The recording in question is a performance of Ravel's Piece en forme de habanera, performed by Leonid Kogan on Revelation CD RV10020. The waveform can clearly be seen to by asymmetric. It is interesting to compare this with the second example shown below, taken from a few seconds later on the same track.
The interesting point is that in the first case the spikes are ‘upwards’ and in the second they are ‘downwards’. The reason for this is not obvious. So far as I am aware, the recording was made in a single session and is a single take. (The track is only 2m 36s long.) It is possible that the violinist moved, or that the change of peak-sign is due to the note being a different pitch. An interesting possibility is that in one case the note was ‘up bow’ and the other was ‘down bow’ since we may expect the direction of bowing to be significant.
It is possible to misunderstand the implications of Fourier theory and think that since waveforms can be represented as a series of sine/cosine components then, since each sinusoid component has symmetry, the result must also invariably be symmetric. This is a misunderstanding which fails to take into account the effect of the relative phases of components in Fourier representations. As a result of this we must also bear in mind that power-frequency spectra do not tell us the whole story.
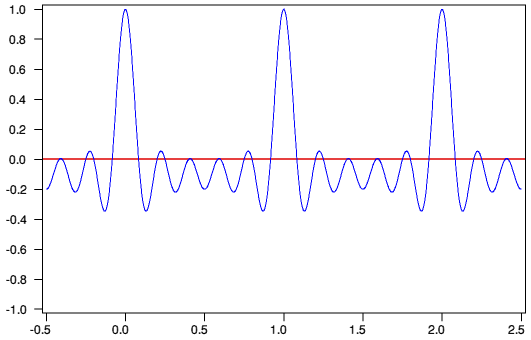
The above waveform illustrates an example of a clearly polarity asymmetric waveform. This is composed simply of the linear sum of a cosine fundamental and its first four harmonics. The point here is that any waveform - symmetric or otherwise - can be represented using Fourier analysis as a set of sinusoidal components. However to preserve the information about the waveshape, the details of the relative phases are vital. In the above example, the cosine fundamental and harmonics are all in phase at the time = 0. Changing the phase relationship would maintain the same power-frequency spectrum, but alter the actual shape of the waveform.
