Sales of CDs and Vinyl in the UK and USA
Comments are sometimes made in audio magazines and elsewhere about sales of CDs and Vinyl as music formats. A recent example in a UK magazine said that sales of ‘vinyl’ were growing. However these reports don't give all the details. With this in mind I thought it would be useful to collect the relevant figures so people could see them and judge for themselves what significance they might have.
First, lets look at the figures for the UK, as published by the British Phonographic Industry (BPI).
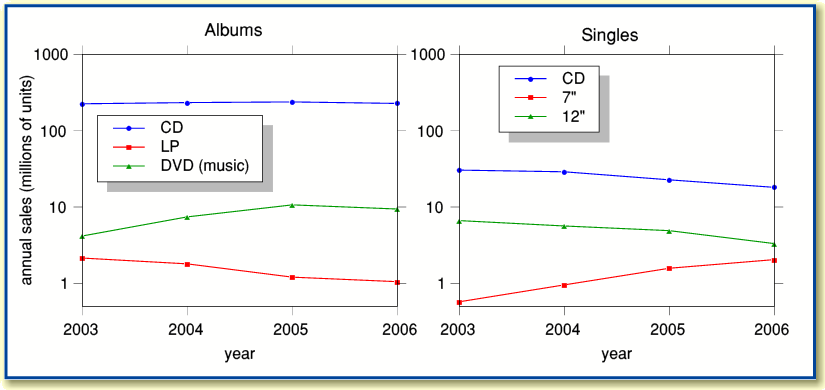
The above graphs illustrate the sales of some music formats in the UK in the last few years. The values shown are in millions of units sold, and represent the annual totals to June of each year. The values are based on data provided by the BPI.
Note that the vertical scales are logarithmic. This makes it easier to see the variations in sales for the various formats and compare them on the same graphs. The left-hand plots are for albums, and the right-hand plots for singles. The figures for DVD only represent music discs, not films or TV programmes.
BPI Sales Figures
| Year
|
CD
|
LP
|
dvd
|
CD single
|
7"
|
12"
|
| 2003
|
224.819
|
2.143
|
4.172
|
30.415
|
0.573
|
6.632
|
| 2004
|
233.106
|
1.798
|
7.422
|
28.911
|
0.954
|
5.639
|
| 2005
|
237.848
|
1.205
|
10.662
|
22.683
|
1.576
|
4.897
|
| 2006
|
227.227
|
1.051
|
9.403
|
18.079
|
2.045
|
3.316
|
The above table lists the sales figures published by the BPI (in millions of units per annum) and which are plotted above. The figures above don't include internet downloads or the growth in the sales of non-music DVDs. Given the rapid growth of these other media it is interesting that there has not been a dramatic decline in the sales of all the music formats represented above!
Now sales figures for the USA/North America, as provided by the Recording Industry Association of America (RIAA).
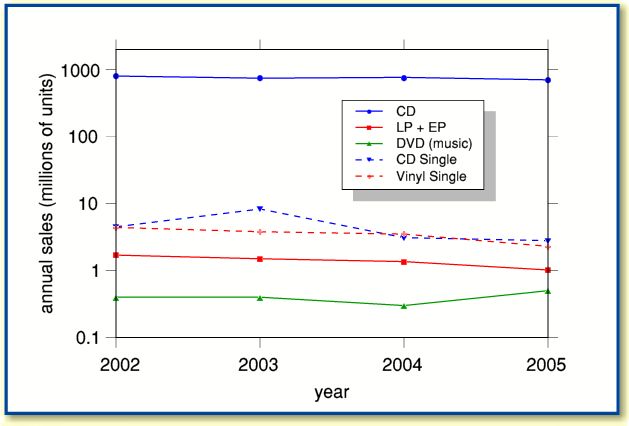
The above graph shows plots of sales figures (again in millions of units per year) provided by the RIAA. These indicate the levels of sales in North America. Note that these values are collated on a different basis to those from the BPI. The RIAA figures are per calender year. Hence at the time I prepared this page (September 2006) no 2006 values were available. The RIAA also group the published figures differently, so combine vinyl LP and EP, and do not distinguish between 7 and 12 inch singles.
RIAA Sales Figures
| Year
|
CD
|
LP + EP
|
dvd (music)
|
CD Single
|
Vinyl Single
|
| 2002
|
803.30
|
1.70
|
0.40
|
4.50
|
4.40
|
| 2003
|
746.00
|
1.50
|
0.40
|
8.30
|
3.80
|
| 2004
|
767.00
|
1.36
|
0.30
|
3.10
|
3.50
|
| 2005
|
705.00
|
1.02
|
0.50
|
2.80
|
2.30
|
Although interesting as a general guide, the above figures should be interpreted with caution for various reasons. For example: The BPI and RIAA figures shown may omit the sales of some of the smaller, independent, music companies. Although it is likely that these only form a relatively small percentage of the total, it is difficult to assess the effect of this omission without sales figures from the independents involved. As pointed out above, the figures shown also don't take into account downloads. Hence the figures kindly provided by the BPI and RIAA above are useful as a general guide, but may not reflect all the details of the situation.
The figures shown above also only cover a few years. It can be seen that there can be quite marked up-and-down fluctuations from year to year. Hence we would need to proceed with caution if trying to extrapolate long-term trends from the figures shown on this webpage. It is also difficult to directly compare the values for the two countries due to differences in the ways formats are collected together and counted.
17 Sept 2006
Sources:
- BPI Quarterly Market Review - Quarter 2, 06
- RIAA 2005 Year End Statistics
Both organisations acknowledged with thanks.


