Gallery of LP modulation statistics
This page provides some additonal results to accompany the article on the modulation levels found on various LPs. It gives some extra examples, and some more info about some of the LPs examined in the main article
Figure 1
Figure 2
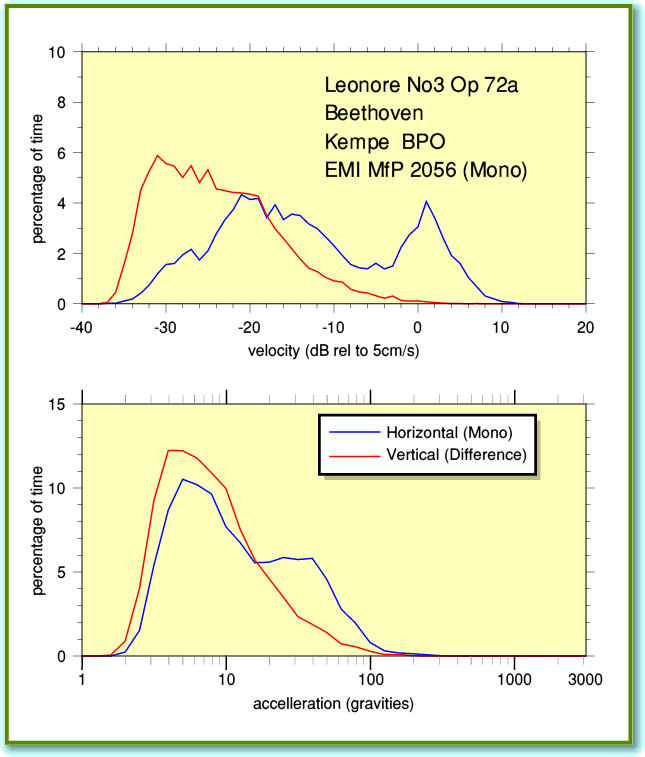
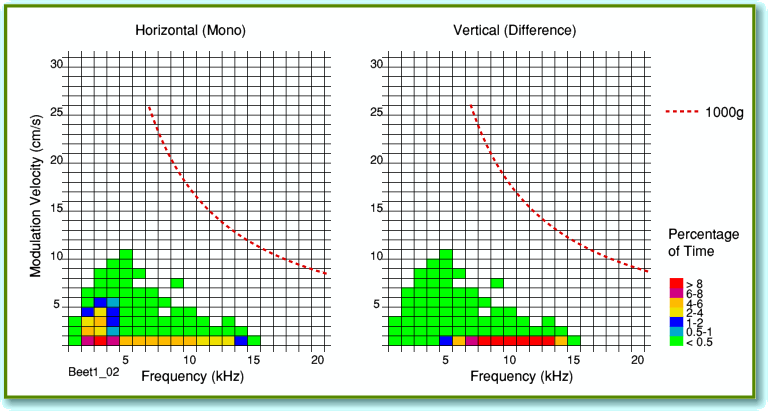
Figures 1 and 2 display the results for a very old mono LP bought in the early 1960s and played with a variety of poor stylii in the past. So the LP is noisy and worn. The interesting feature here is that – in principle – there should be no difference (vertical modulation) signal at all. The levels seen are well above what can be explained by replay system crosstalk, etc. May be due to LP noise, wear, or the stylus rattling around in the large mono groove.
Figure 3
Figure 4
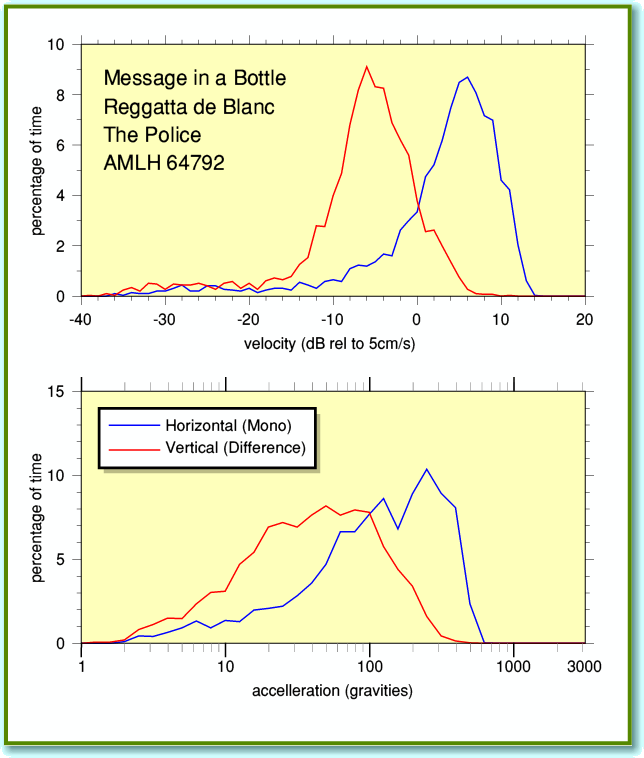
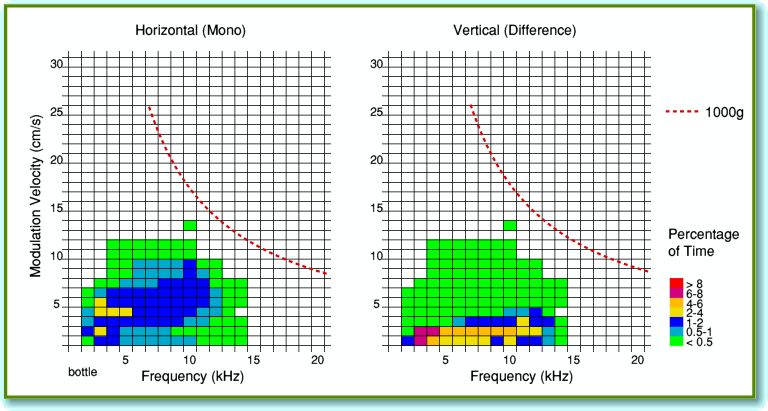
Figures 3 and 4 show results for a 1980s ‘pop’ LP. As with other pop/rock examples, the difference channel level tends to be lower than the mono channel level. Not sure if this is due to a dominance of near-mono ‘pan pot’ contributions to the mix, or the result being processed to compress upwards the mono waveform whilst leaving the difference modulation low to avoid cutting/tracking problems which might arise with high vertical modulations.
Figure 5
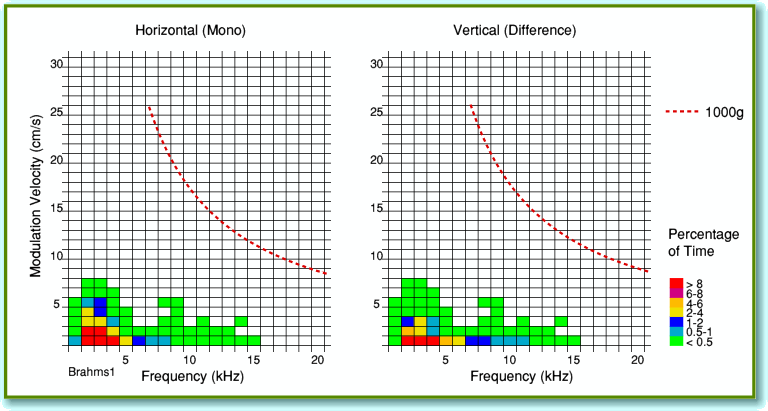
Figure 5 shows the 2d plots for the Brahms LP used in the main article. This is a 1970s ‘quadrophonic’ LP made by EMI using the ‘SQ’ system they adopted. I chose this as the QS and SQ systems used out-of-phase components to encode the signals for the rear channels. So you might expect that the difference channel levels would be higher than on a conventional stereo LP of classical music. However there is little sign of this being the case. The LP does not exhibit the ‘phasey’ effects some SQ/QS discs produced, so the level of rear channel info may have been deliverately kept low to avoid upsetting stereo listeners. As with other classical LPs the modulation levels are also lower than typical rock/pop LPs.
Figure 6
Figure 7
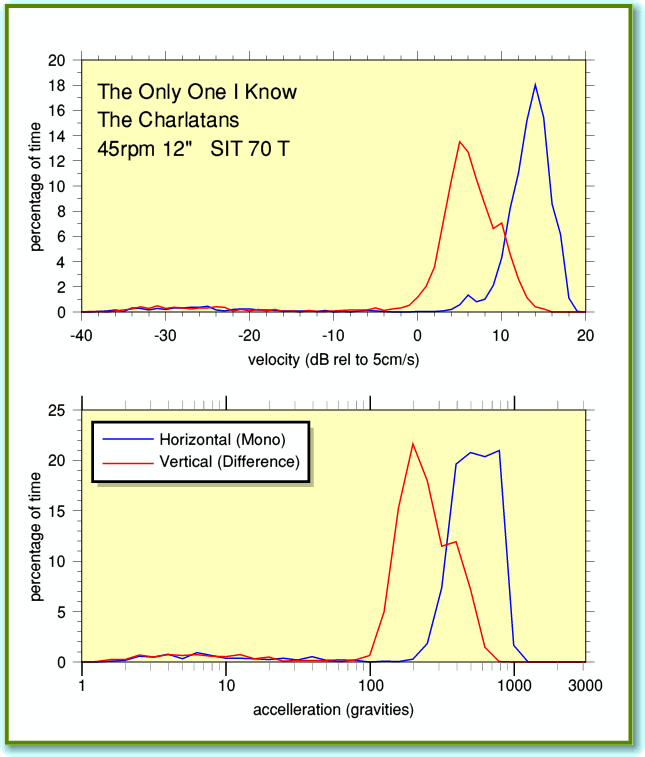
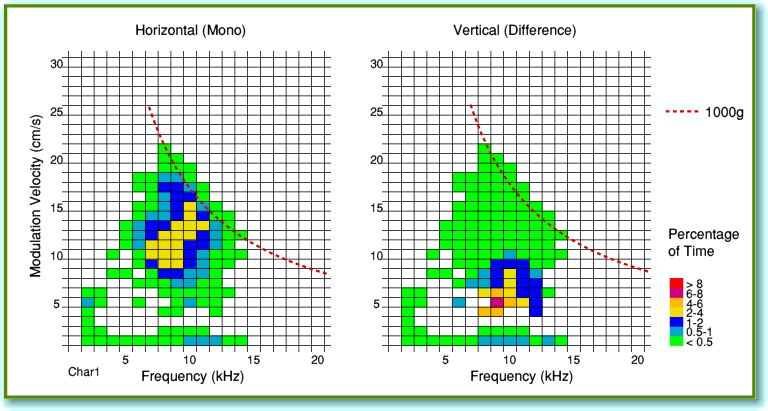
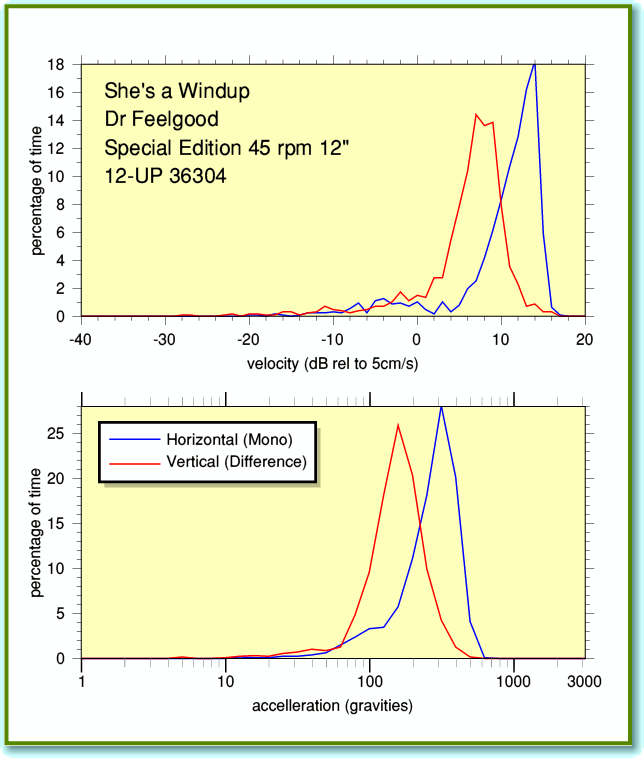
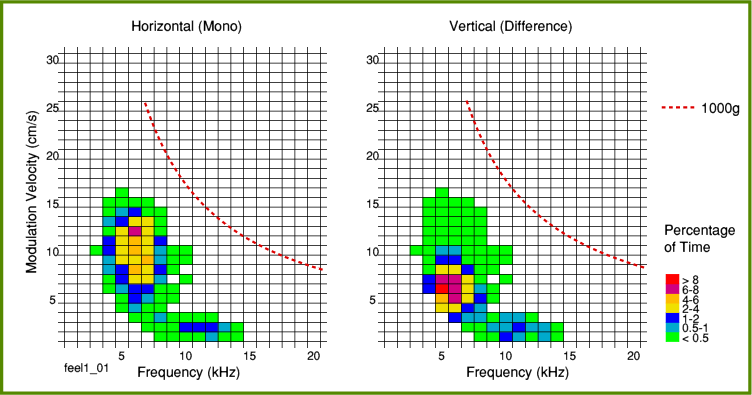
Figures 6 and 7 are from an example of a loud pop 12" 45 rpm disc. The results show clear signs of being level-compressed, and the disc gave about the highest peak accellerations and velocities I found on any disc. Again, the mono channel tends to be markedly louder than the difference.
Figure 8
Figure 9
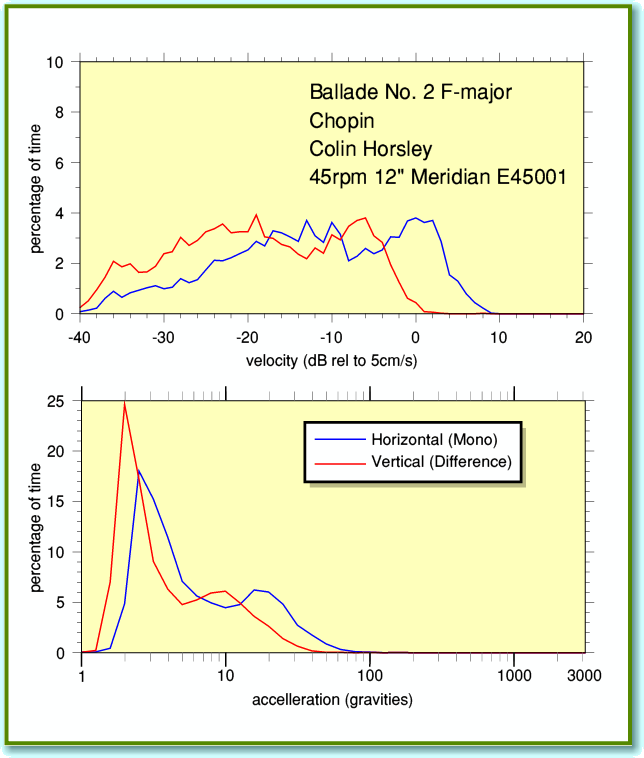
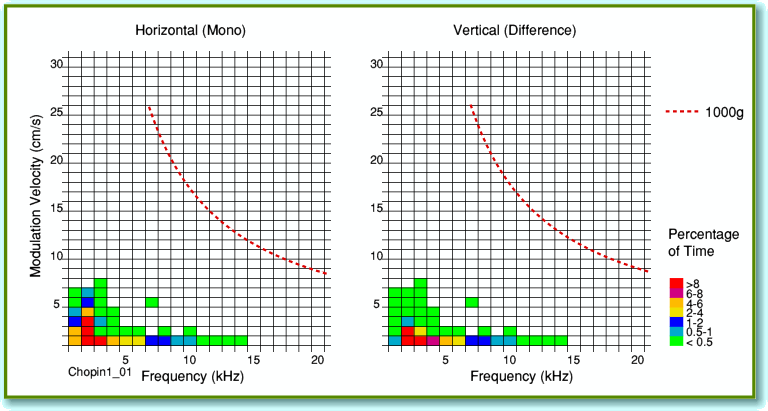
Figure 8 and 9 are for an example of a 12" 45rpm disc of classical music. It is a track taken from a set of Chopin Ballades on the Meridian label. Produced in 1980. The overall levels of modulation are very low. Listening to the disc it seems to me to lack low-frequency content, but the frequency/velocity distributions are towards the low end of the spectrum due to the absence of much in the way of large accellerations which might be expected from the starting transients produced by piano notes being played. Also seems to have a marked discrepency between the mono and difference signals.
Figure 10
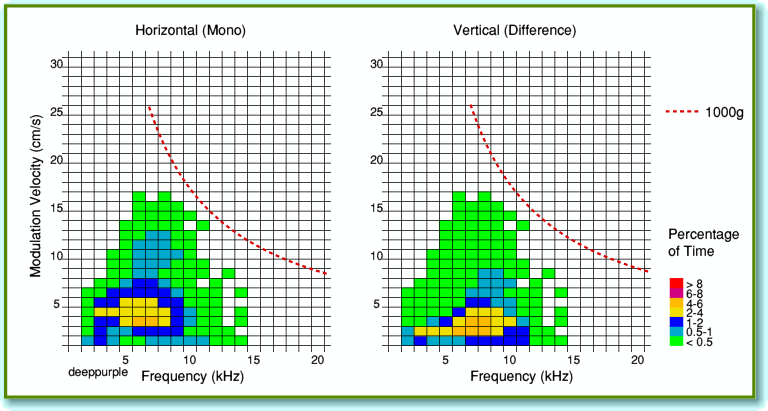
Figure 10 shows the 2d plots for the well-known Deep Purple LP track I used as an example oin the main article. I bought this LP some decades ago. It seems to have a reasonably wide dynamic range for heavy rock music and shows signs of not being ‘processed’ as much as many modern pop/rock recordings.
Figure 11
Figure 12
Figures 11 and 12 are for another example of a 12" 45rpm pop/rock recording, The plots show strong signs of the recording having been level compressed. Also the usual signs of the mono level being higher than the difference. Does not reach peaks as high as the Charlatans example, though.
Figure 13
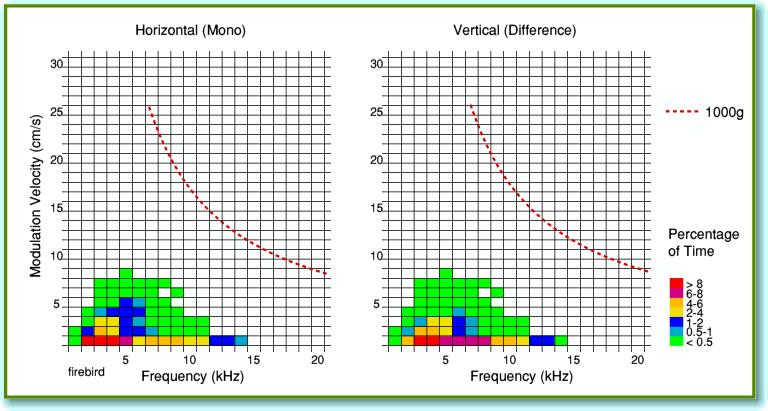
Figure 13 shows the 2d plots for the Firebird LP which I used as an example in the main article. This is an old stereo LP of classical music. Mono and difference levels more similar than the pop examples, and shows a wide dynamic range. The peak levels are quite low. This is a ‘filler’ on the second side of the LP.
Figure 14
Figure 15
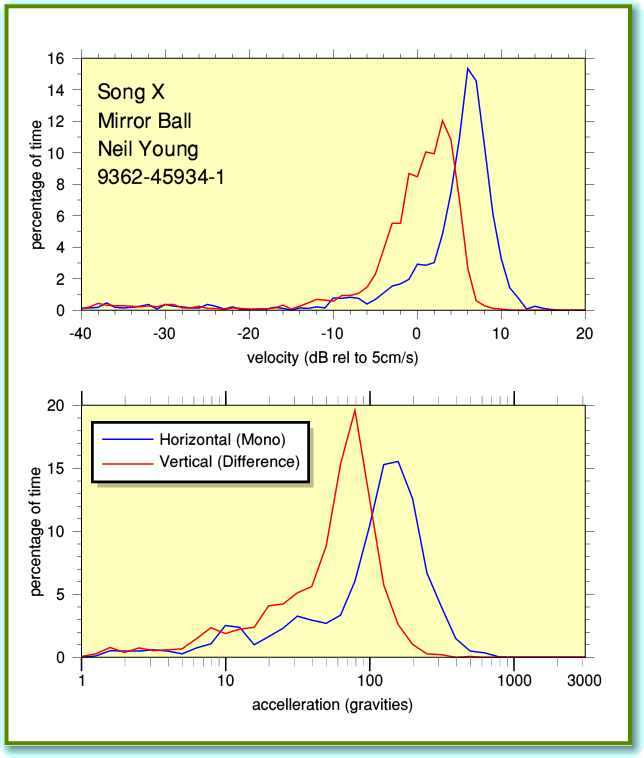
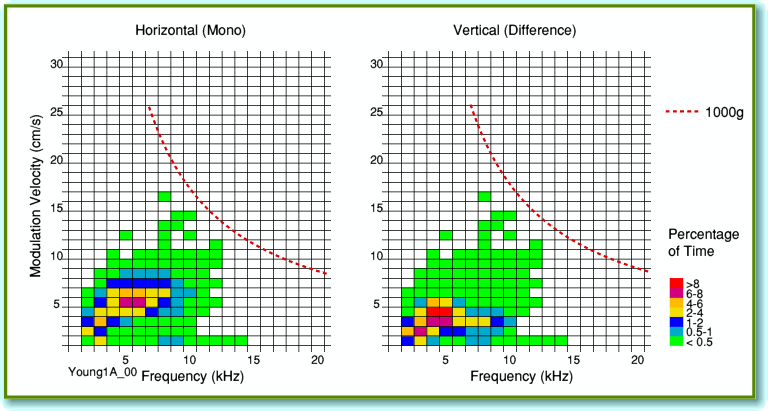
Figure 14 and 15 are taken from the first track on the Mirror Ball double LP by Neil Young. Shows signs of being level compressed with a marked mono-difference discrepency. But the peak levels are lower than on some of the other discs.

