Over The Top - Measured Results
Back in 2007 I wrote an article (Over The Top)looking at the implications for digital players/DACs of the way some audio waveforms may need to reach peaks above 0dBFS in between the sampled values. This means, for example, that although all the sample values on an Audio CD or computer file are limited to a maximum of 0dBFS the reconstructed waveform may have sections that need to exceed this.
At the time I didn’t investigate the behaviour of real commercial CD players or DACs. I was, however, discussing this with Keith Howard who writes for Hi Fi News. He did some measurements which appeared in print in the magazine, but not on his website. So with his permission I am now making them available here so people can see some examples of how optical disc players/DACs cope (or not!) with inter-sample peaks.
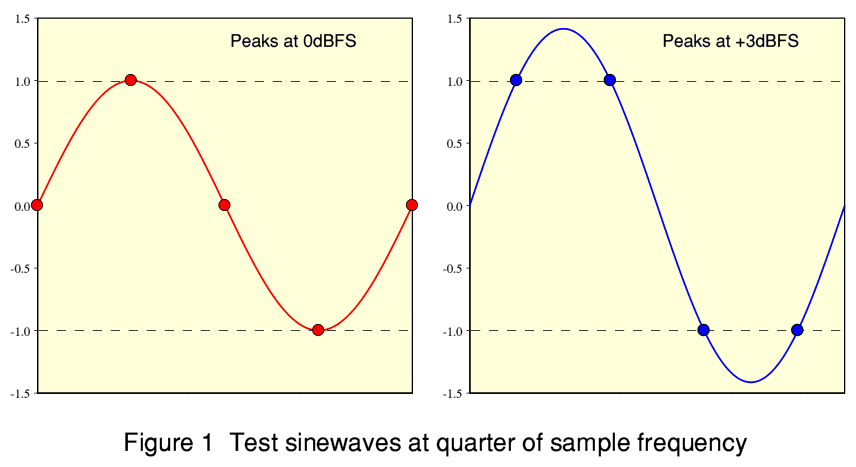
Figure 1 illustrates the two test waveforms Keith used. Each consisted of a pure sinusoid whose frequency is set to be exactly a quarter of the sample rate. So for Audio CD (sample rate 44100 samples/sec) the test sinewaves have a frequency of 11025 Hz. There are exactly four samples per cycle, and they appear at the same phases/positions during each cycle. For clarity I represent the allowed range of values to be +/-1. So the 0dBFS level corresponds to an sample magnitude of 1.
The waveform on the left, shown in red, has the samples aligned so that two of them are at the peaks of each cycle of the defined sinewave. This means the largest sinewave that the samples can represent has a peak amplitude of 0dBFS. However if we shift the samples so that pairs of them sit symmetrically either side of the peaks we can get the waveform on the right, shown in blue. In this situation, maximising the sample values leads to the sinewave they define reaching peaks 3 dB above the 0dBFS level! During the times between some samples the output level exceeds the maximum level allowed for any sample. But the waveform is still defined by the series of samples to be a 11025 Hz sinewave.
Although these are artificially created test waveforms the examination I did in 2007 shows that audio CDs do include sample values up to 0dBFS and require the reconstructed musical waveforms in between to sometimes rise above this level. So if players alter or distort these peaks the sound may be changed.
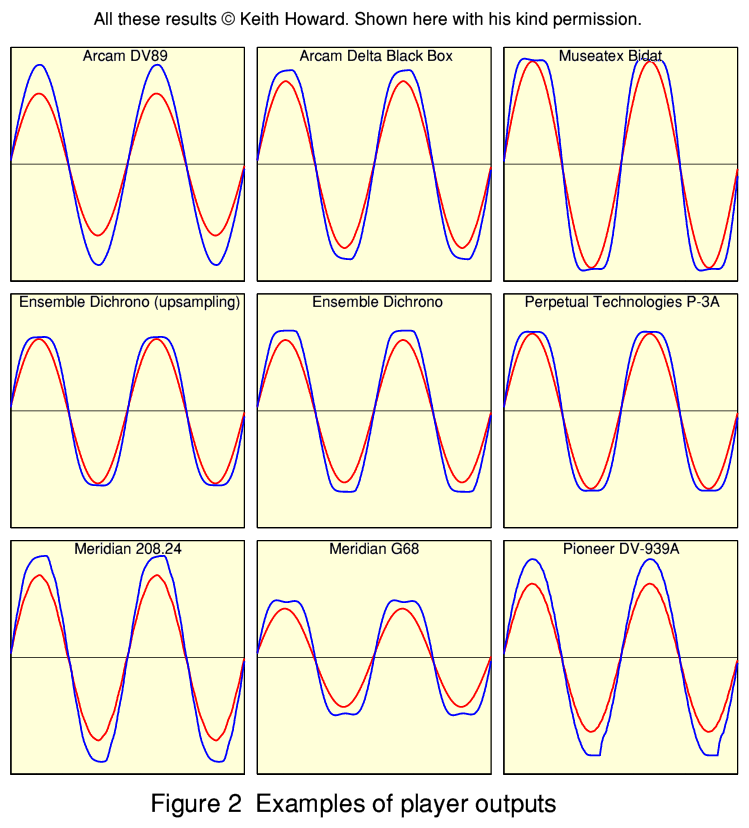
Figure 2 shows the results Keith obtained using 9 different players in 2007. The red lines show the results when playing a 0dBFS 11025kHz sinewave with the sample values aligned to the peaks. The blue lines show the results when playing a sinewave with the sample values aligned to define a waveform that should peak at +3dBFS. Ideally, for every player both lines should show a pure sinewave, and the blue line should simply have an amplitude about 40 percent larger than the red line. Alas, you can see that - for the players examined - only the Arcam DV89 approaches this ideal. All the other players clearly squash or distort the peaks of what should be a +3dBFS sinewave.
So it looks like we can’t take for granted that all commercial players (and by extension other equipment like computer DACs, etc) can correctly handle waveforms where the sample values define a reconstructed waveform that needs to rise above 0dBFS. Indeed, if the above survey represents the general situation it looks like most players will distort some musical peaks, Maybe this, combined with the modern tendency for CD makers to level compress and clip, is sometimes a reason for one player ‘sounding different’ to another as a matter of “choose the kind of peak distortion you prefer”!
Jim Lesurf
23 July 2012