Ringing on the line
In some ways it surprises me to find that people still have a keen interest in LP replay. During the late 1980s and into the 1990s it was widely taken for granted that vinyl was to become obsolete and ye olde mechanical systems like this would be replaced entirely by a new digital world of discs... and then files. But somehow the LP has remained, and has now seen a resurgence! So alongside some of us old, erm fogies, there seems to be a new generation of people adopting the LP as their music carrier of preference.
However the actual performance of an LP replay system depends crucially on a number of poorly understood mechanical factors. This remains the case despite many engineers in the past putting a lot of effort into analysing, designing, and building the best replay systems they could.
Here I want to look into one specific area - the behaviour of the stylus assembly which represents the key link between the mechanical groove and the output electronic signal which is read from it. Note that for simplicity I am ignoring the arm and turntable of a record deck and only looking at the high frequency behaviour of the stylus tip, cantilever shank, suspension, and the mechanical effects of the attached generator at one end and the LP vinyl at the other.
Older audio engineers may remember now-near-mythical names like Walton, Kogan, etc, who did a lot of work which resulted in some superb cartridges. Back in the ‘BC’ (Before CD) era most of the analysis was based on using what are called ‘lumped element’ analysis where properties like mass, spring stiffness, etc, were treated by analogy with electronic components like inductors, resistors, etc. This let engineers devise equivalent circuits based on their understanding of the mechanics involved using standard approach of AC circuit maths to work out answers. Unfortunately, this led to different schools of thought regarding what actual mechanical factors gave rise to the various detailed quirks of the behaviour. The result was that the area did remain shrouded in some mystery and left us with some unresolved questions.
These days a graduate mechanical engineer would be more likely to turn to their computer and apply what is called a ‘Finite Element Model’ (FEM). This essentially describes the mechanical system as a complicated 3-dimensional array of many tiny and interlinked parts. It then proceeds to try and analyse this by running a fairly powerful computer. The power of modern number-crunching hardware makes this feasible. But the complexity of the actual computation process can still get in the way of really understanding what’s going on. And even tiny misjudgements about how to set up the details of this numerical 3D ‘animation’ can lead to errors in the results which can then be hard to spot.
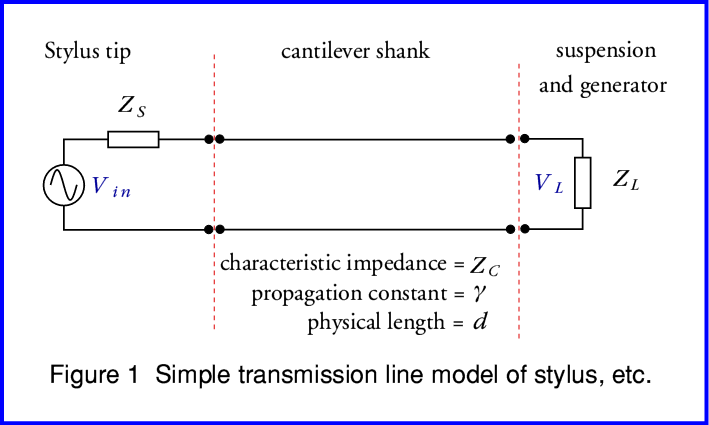
Fortunately, there is an intermediate approach which in the past seems to have generally been overlooked. One which is simple enough to help engineers think though the system, and to present them with some equations they can solve or understand. And which can more easily provide us with calculated results whilst avoiding many of the practical complications of FEM. This approach is based on regarding the stylus assembly as if it is a mechanical ‘transmission line’ driven by a mechanical generator – the stylus tip and LP groove – at one end and loaded by its suspension and output generator at the other.
For those who want the full monty, I’ve written a short document that gives more details of the gory mathematical details. If you aren’t alarmed by the sight of equations you can find a (Adobe PDF) copy by clicking here. From this point, though, I’ll just summarise the method and give some example results.
For those not familiar with this kind of approach the impedances (Z values) can be thought of as indicating, say, how much force is required to produce a given amount of movement. And the voltages can be thought of as the signal levels (movements) being passed though the system. The ‘propagation constant’ is actually a complex number that determines how swiftly a mechanical movement will pass along the cantilever and the extent to which some of this movement may be ‘lost’ along the way by some of the mechanical energy being absorbed. Using this kind of thinking an engineer familiar with transmission line systems can easily write down a set of analytical equations that define the behaviour of the system as a function of frequency.
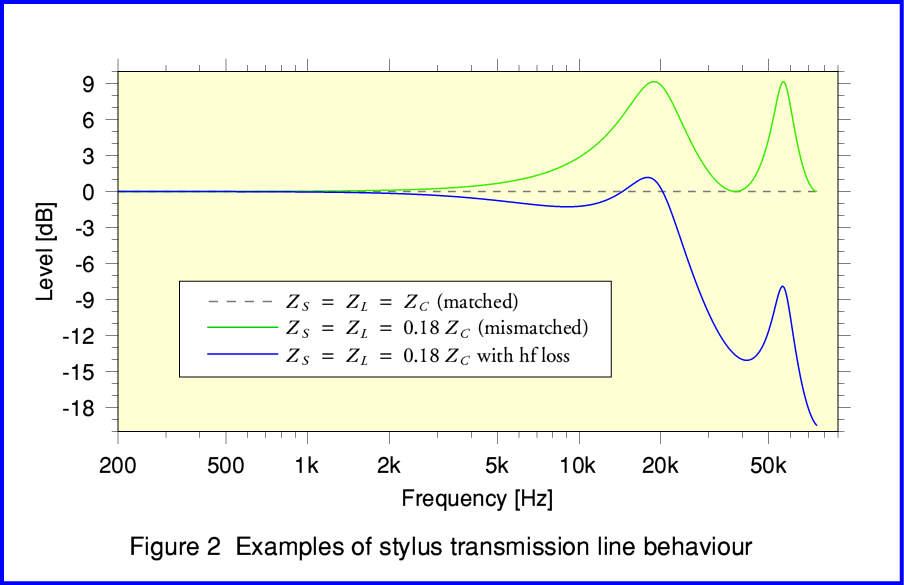
Figure 2 illustrates some examples the kind of behaviour we can expect from such a system. The graph shows three different cases.
The first [shown by the broken line] is when all the impedances ‘match’ – ie they all have exactly the same values – and there are no losses in the system. The result is a flat frequency response .
The second [green line] is when the source (stylus tip and groove wall movements) and load (stylus suspension and attached electronic signal generator) have effective mechanical impedances which both differ from the stylus shank’s characteristic impedance. The result is a frequency response that has a series of peaks or dips. The frequencies at which these occur are determined by the ‘trip time’ required for a mechanical vibration to travel from one end of the shank to the other. Because of the impedance mismatches some of the vibrational energy ‘bounces’ and travels back and forth like a series of echos which emphasise the output at some frequencies.
The third case [blue line] is almost the same as the above, but here we have taken into account that some signal vibration energy will tend to be lost by various mechanisms, and that these losses tend to increase with frequency. This tends to ‘damp down’ the signal levels at higher frequencies. The result is shown by the blue line. These losses may be due to factors like the elasticity of the suspension and/or vinyl not being loss-free, or due to the finite curvature of the stylus shape which tends to lead to a reduction in output at HF for geometric reasons. Indeed, at very high frequencies the geometry of the tip’s shape and the elastic deformation of the vinyl may essentially suppress any clear variations response.
In general, therefore, the shape will tend to show the stylus shank ‘transmission line’ resonances, but then be modified by the way various loss mechanisms in the system damp down or reduce the response at various frequencies.
It is worth noting at this point that Figure 2 extends up to over 50kHz. In practice most of the measured plots you tend to see in magazine reviews, etc, of LP replay cartridges tend to cut off at about 20kHz or just above. Hence these tend to generally show a dip and peak in the 10k - 20k region, but fail to show any higher peaks or dips in response. However if we ignore the portion of Figure 2 that shows the region well above 20kHz we can see that the general shape shown by the blue line looks fairly consistent with the behaviour of good quality real cartridges.
It is also worth noting that – for Moving Magnet designs in particular – the response tends to vary with the electronic loading presented by the pre-amplifier. Hence the common practice of adjusting the electronic load resistance and capacitance connected to the cartridge output to try and achieve the flattest and most extended response. As a result, people can sometimes confuse the resulting electronic effects with the mechanical ones. Whereas in practice, one may be used to help ‘correct’ the other. This may also be possible for Moving Coil designs, but tends to require much larger capacitance values!
If we look back though various old research papers, etc, from the 1970s and before we can see that these often disagreed about the detailed causes of the various characteristics displayed when cartridge and stylus measurements were made. It is also far from clear what the actual mechanical impedance values may be in many cases. Add to this the likelihood that the values may well be frequency or signal level dependent and these uncertainties and disagreements even amongst engineers who’d spend decades working on the topic become understandable. As a result, cartridge design, and optimising performance in use became more of a black art than a matter of widely understood engineering!
Sometimes an HF resonant peak has been assigned to the effective tip mass and vinyl compliance. Whereas in other cases it is assigned to the stylus inertia and compliance. And where two different HF resonances have been seen, this may be regarded as being due to these two different effects. Whereas the transmission line way of thinking allows us to regard the presence of multiple HF peaks (usually one being well above the other in frequency) being possibly being due to them being successive resonant peaks caused by same mismatched line behaviour.
Finally, it is worth noting that real cartridges tend to have different values for some of their properties – most notable, suspension compliance – in the vertical and horizontal directions. Hence their resonant behaviours in those two planes will tend to differ. In some cases this might mean the optimum electronic loading would differ for vertical and horizontal displacements. A complication which is made worse when we realise the actual outputs tend to be ‘left’ and ‘right’ – i.e. angled at 45 degrees to vertical/horizontal – so involving both vertical and horizontal displacements!
1600 Words
Jim Lesurf
7th June 2017