Mostly Quite 'armless?. . .
Around five years have elapsed since I first had a look at the MQA system. Recent events have prompted me to return to the topic. In particular, MQA encoded ‘Audio CDs’ and streams became available, and someone using the name ‘Golden One’ recently decided to run some files though the MQA process to help us assess how it performed. As a result, this spawned threads on two web ‘forums’ – Audio Science Review and Pink Fish Media which then led me to return to the topic. This page is one result...
If you haven’t already done so, I’d suggest that at some point you may find it useful to look at the earlier webpages I wrote which relate to MQA. [1] [2] [3]. And all being well I’ll deal with some other aspects of how MQA functions on another webpage in the near future. Here I want to focus on the impact of MQA upon our ability to choose the format or version of the music we like when we may not have an MQA DAC/player. To do this I will use some evidence garnered from files I have obtained an whose contents I have analysed.
A number of Audio CDs have apparently now gone on sale which are only available in MQA encoded form. Similarly, one streaming company has begin to stream MQA material. Audiophiles may then wish to try these and compare them with non MQA-alternatives. But here they hit a snag. Most CD players and DACs currently can’t ‘decode’ MQA and therefore play the material as being conventional LPCM. As I understand it, MQA say this is fine because MQA is ‘compatible’ with LPCM rendering. However this claim was also made for HDCD and in that case experience showed that we had to interpret the term ‘compatible’ with care.
In some instances you can play an HDCD on a non-HDCD player and it sounds fine. But in other cases it may sound odd. When analysed these examples tended to show peak compression of the musical waveforms. (CF [4] [5]) As a result HDCD was only really ‘compatible’ in the sense of having no audible impact on normal replay when its application was slight. In practice it meant that the result of decoding an HDCD gave you pretty much what you could have obtained if the disc had just been a well-made non-HDCD in the first place! Which is actually what Information Theory tells us to expect, alas.
Two of the ‘selling points’ for MQA are that:
Hence it may be argued that it can be employed by music suppliers to adopt a ‘single inventory’ approach where they can simply provide this ‘compatible’ material without it degrading conventional replay. However most listeners will still be using non-MQA rendering systems. And people who use streaming or file downloading but need to keep to low stream rates or file sizes may have to choose between conventional standard rate LPCM and MQA. i.e. they may not have the option to stream high rate LPCM. That may make MQA particularly useful for them, but may also mean they can only easily judge by comparing MQA with standard-rate standard LPCM. Which means the effect of MQA material on non-MQA rendering systems does matter.[6] This raises the need to ensure that any comparison is ‘fair’ and that any ‘difference’ is due to MQA and not some other factor. Unfortunately, this requirement raises some difficulties in practice...
One example of this is when someone who is happy with their CD Player wishes to check to see if an MQA encoded Audio CD is ‘compatible’ in the sense that it sounds indistinguishable from a well made non-MQA CD of the same source material. If they find the versions do sound ‘different’ the question becomes – is this due to MQA encoding or arises due to some other ‘difference’? For example, perhaps the MQA CD was generated from a version of the source material which isn’t available via a non-MQA CD or file?
Similarly, if someone does have an MQA decoder, how can they check if an MQA version of material sounds the same as the conventional ‘Hi Res’ version? In this case, a non-MQA hi res file may remain available. But is it a copy of what went into the MQA encoder? If not, has it be been made different in ways that either mimic any changes made by MQA , or for any other reasons?
Part of this dilemma arises because – if I understand correctly – MQA are concerned that if people know both the input precise input to MQA encoding and its resulting encoded output they can then this information this to work out the details of MQA encoding and decoding which are currently kept as ‘trade secrets’ by MQA. Hence anyone making and distributing MQA encoded material is required prevent people having access to precisely what was fed into the encoder. The implication being that any non-MQA hi-res alternative on offer must differ significantly from what was given to the encoder.
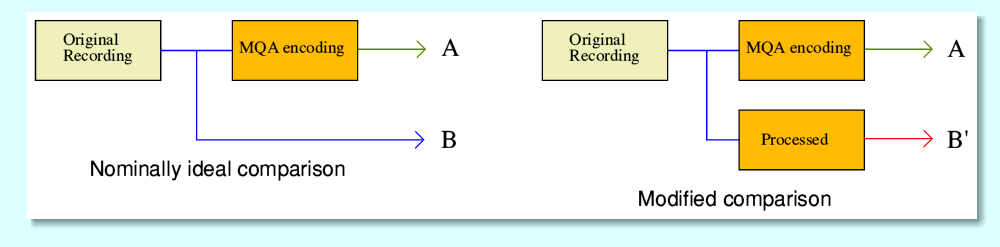
This means that when we might wish to do a comparison – by listening or by analysis – we may not have the ideal case illustrated above where we can compare A with B. Instead we may have something akin to the modified case shown above where we only have the ability to compare A with an altered version, B’.
Given all this, how can an end-user make a decision about the impact of MQA compared with standard approaches to hi-res audio? We may well hear a difference or find one via analysis, but then cannot be sure if this is due to MQA or is down to something else. Similarly we may decide that the A and B’ outputs sound the same – even if analysis shows differences – but if we only had B’, not B, can’t tell if B would have sounded different to A. And all this is without considering possible differences in how our replay may respond differently for other reasons!
To explore this question further two useful sets of files have become available. One set have been made officially available by the ‘2L’ company and can be downloaded via a webpage[7] . These have the blessing of MQA and are well worth a listen even if you have no interest one way or the other in assessing or using MQA! It includes some excellent recordings of wonderful music. However if you look carefully at the wording on their webpage you may notice that it doesn’t actually say that any of the versions available are B, not B’. One column is labelled, “MQA stereo original resolution” but this doesn’t make clear if it is actually the result of decoding the MQA-CD data! (N.B. The details of this webpage have changed in the past, and may well change again, so what is on offer may alter, as may the descriptions, etc. The above is correct as I type this.)
The second set of files nominally avoids the above problem. Their creator – who has done this under the name “Golden One” – has provided these and said that they include the actual input files sent to ‘Tidal’ for streaming, along with the resulting MQA output, etc.! (From this point I’ll refer to these as the ‘GO’ files.) Because I don’t know who GO may be and can’t be certain the files are as they claim these files do need to be treated with some caution. But examining them may help shed some light on MQA, so they are worth investigating. As a result, I have been analysing examples of both sets of files and can now give some of the findings. For this analysis and comparisons I have been examining the files with the MQA ‘compatibility’ argument in mind. So am mainly examining differences in terms of LPCM. That said, the GO files do include ones which are said to be the results of decoding the MQA versions, and I will report on them at a later stage. I also intend in the future to be able to do a wider examination of correctly decoded MQA. But the results from that will also be left for another webpage.
| 2L File number | Content |
| 038 | Mozart Violin Concerto |
| 087 | Hoff Ensemble - Quiet Night Winter Jazz |
| 106 | Arenesen - Magnificat |
| 145 | Hoff Ensemble – Innocence (Polarity) |
For the sake of analysis I chose the above subset of the 2L files for my initial examination and comparison. In practice it was almost a random choice just to sample what I might find. I have given detailed results in case this helps anyone else who wishes to investigate further or check what I found. The following summarises my initial results, recording by recording, starting with file set 038. The spectra are all on 8k points/FFT and thus for 44k1 sample rate material have a resolution (bin width) of 5·3833 Hz.
2L File: 038
| File | bit/s | duration sec (bytes) | FFT span |
| 2L-038_01_stereo_FLAC_44k_16b | 16 | 554·8918 (97,882,912) | 0 - 500 sec |
| 2L-038-MQA-2016_01_stereo | 16 | 554.8933 (97,883,184) | 0 - 500 sec |
| 2L-038-original-2006_01_stereo | 16 | 554·8933 (97,883,184) | 0 - 500 sec |
Note that in the following plots the red/blue lines show the power spectra of the left and right channels time-averaged over most of the file content. (The actual spans are specified in the relevant tables.) The green/black lines show the highest powers found by any of the individual FFT’s during the scan. Thus the plots give an indication of the typical spectrum and the peak levels reached at each frequency during the scan. Note also that the term ‘Red Book’ indicates the Philips/Sony ‘Red Book’ which defined the content and format of Audio CDs.
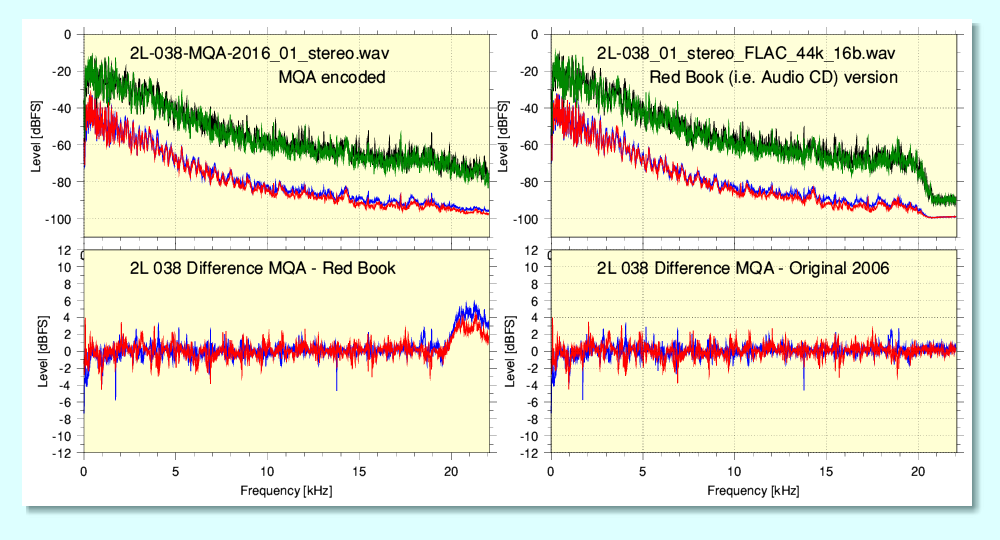
A point to notice here is that the Red Book version which is presented as equivalent to the MQA example has had a low-pass filter applied to it which rolls away the HF in the region around 20kHz and above. Curiously, an earlier version in CD format (i.e. 44·1k/16bit) does not have this filter applied to it. However the MQA file does not show this drop. If we take the difference between the MQA and Red Book spectra the result is a ‘bump’ in the region above 20kHz. These two files are, again curiously, of slightly different durations. However the 2006 44·1k/16bit version lacks the HF filtering and is exactly the same duration as the MQA version. In that case we get the difference in spectra shown above, bottom-right, and lacks the ‘bump’.
In principle a possible alternative – albeit unlikely – explanation of the above differences is that ‘2006’ file is actually MQA encoded! Indeed, it is exactly the same length as the MQA version which does tend to support that possibility. Hence it would be no surprise that the two have, overall, the same spectrum shapes. But if so, it is curious that the difference isn’t exactly a flat line at 0dB! If it is not MQA encoded then this may indicate that the MQA process spreads some changes across the entire spectral range even when the level of HF is trivially small. Note also that the variations from flatness show a similar pattern in the two difference plots, and have in common their being a difference compared with the same MQA version. This behaviour is at least, intriguing – if only because the ‘Red Book’ version seems to have been passed though a 20kHz low-pass filter that removes any signal above 20kHz. i.e. There is little or no HF in the result which MQA would need to contain.
Overall, the above indicates that the main actual difference would, for standard replay, be due to the MQA version ‘filling the HF hole’ in the Red Book version’s spectrum with what appears like noise to the spectral measurement. However in each case the average and peak levels of HF are quite low. As a result it seems doubtful that there would be much in the way of HF for MQA to encode in the first place, and hence any changes, one way or another, might be trivially small or inaudible. The most likely exception being someone noticing the effect of the absence/presence of the HF noise – which is down to the filtering of the Red Book version, not MQA as such! i.e. A perceived ‘difference’ might be due to one version being low-pass filtered, not the recreation of any actual HF by MQA decoding.
A possible reason for a simple sample-by-sample differ not giving a flat spectrum may be that the two series of sample-values are not time-aligned even if their patterns agree. To check this I did a cross-correlation between the two files.
Cross Correlation
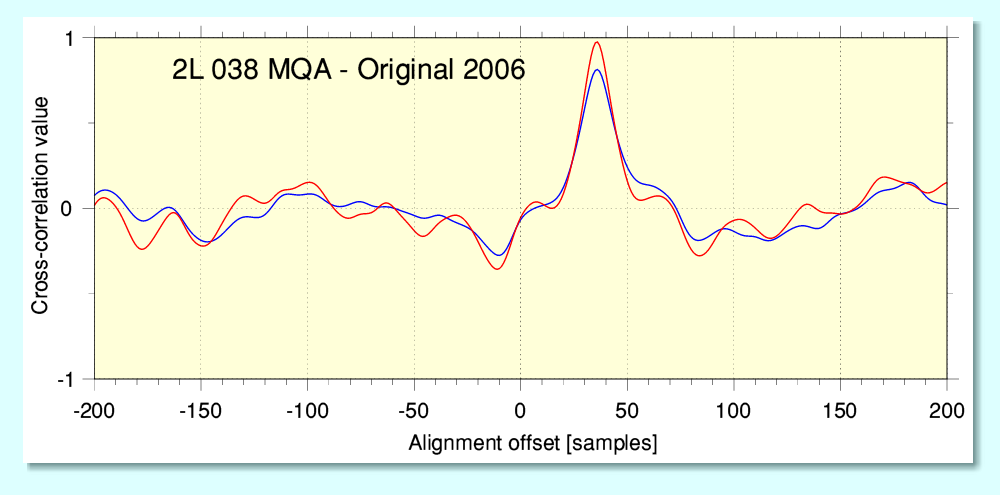
The above graph shows the result. This indicates that the two files are quite similar but there is, indeed, an offset of about 35 samples in their relative timings. (The above was obtained from a cross-correation between two equivalent sections that are 22 seconds in duration.) However the lower peak level for one channel implies that even when this is taken into account the two files are not identical. Cross correlation with the longer version shows almost exactly the same pattern although the peak seems displaced in time by about one sample. In addition the distributions are not symmetric about their peaks which implies some relative frequency-dependent phase dispersion between them. (N.B. This hint of dispersion may be relevant to some of the things analysis of the GO files seem to show.)
2L File: 087
| File | bits/s | Duration | FFT span |
| MQA 2L-087_06_stereo | 16 | 237·4933 (41,893,824) | 0 - 200 |
| RBCD 2L-087_06_stereo_44kHz_16b | 16 | 237·4918 (41,893,552) | 0 - 200 |
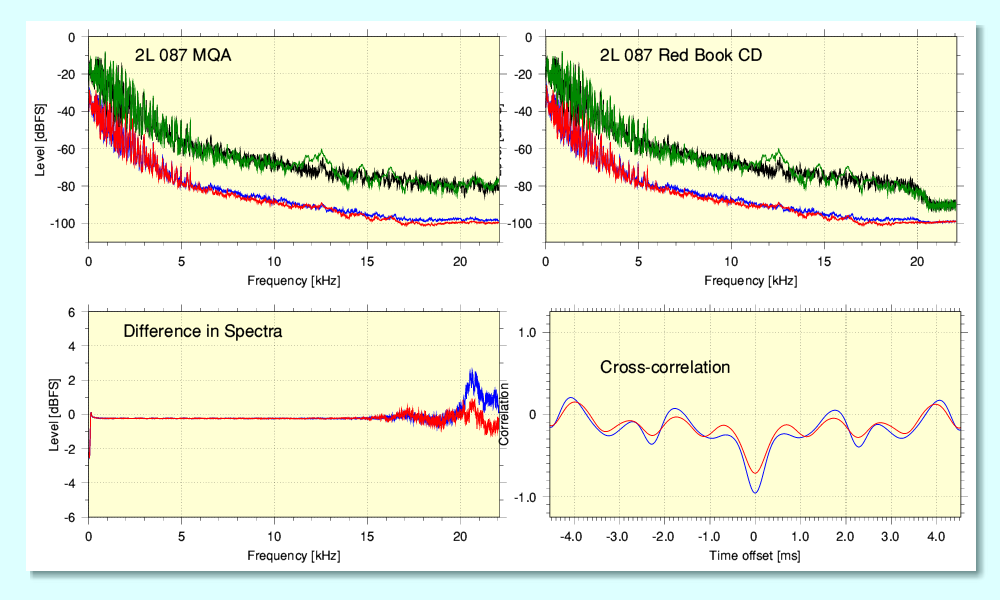
Again, these two versions have slightly different file lengths and differing spectra at the HF end of the frequency range. They also both have almost no HF content. The two channels of the ‘Red Book’ version again seem to have been low-pass filtered. However in the region below about 15kHz the two spectra, although not identical, are very similar and only differ by a fraction of a dB. However they do become distinctly different as we go approach 22kHz. As with the previous example this seems on the surface to be due to the Red Book version having had a low-pass filter applied which is either absent from the MQA version or that “hole has been filled” with MQA process noise.[8]
A curio in this case is that above 20kHz one MQA channel shows a lower HF level at some frequencies than in the Red Book version. This indicates the possibility that the MQA encoding has applied a low-pass filter of its own before adding any of its own ‘process output’ to this region. It is also curious that the two channels seem to differ in this region. However overall, if these files ‘sound different’ it could, once again, simply be due to the low pass filtering and the added ‘noise’ because the level of actual HF information, again, seems very low.
It occurred to me to wonder why the spectral difference below 15kHz was so small – but not zero. Given that the files aren’t of exactly the same length I wondered if – like 038 –they weren’t actually time-aligned. So I did a cross correlation. The result is interested because although the central ‘peak’ is at zero offset the peak is a negative one! This tells us that the files are time-aligned to an accuracy of about 1 sample. (i.e. probably spot on). But it also shows that the content of one file is polarity-inverted wrt the other. In lay terms, the waveform in one file is ‘upside-down’!
This matters because with musical waveforms inversion can mean a result that is audibly different. The best-known reason for this is that conventional ‘cone and box’ loudspeakers tend to exhibit asymmetric distortion. Hence in this case we don’t simply have filtering and added noise perhaps making an audible difference, we also risk the change in polarity altering the perceived sound quality. In each case, the ‘difference’ then potentially being assumed to be due to MQA. I confess that I was surprised that 2L should have let this occur because the sound quality of their recordings in general is superb. But any audible effect will be usually be in the range between subtle and inaudible and will depend on the user’s choice of loudspeakers and listening levels. So may not matter. I only noticed it from seeing the cross correlation results!
2L File: 106
| File | bits/s | Duration | FFT span |
| MQA 2L-106_04_stereo | 16 | 295·2133 (52,075,632) | 0 - 250 |
| RBCD 2L-106_04_stereo_44k_16b_01 | 16 | 295·2133 (52,075,632) | 0 - 250 |
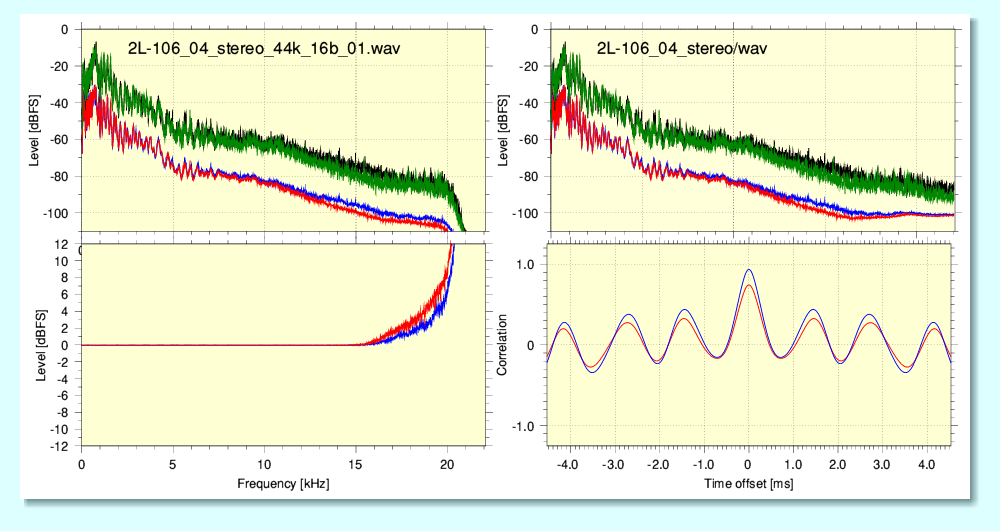
Once again, in this case the Red Book version has clearly had a low-pass filter applied. The MQA version then essentially ‘fills the gap” to show a fairly flat spectrum at HF. The resulting HF difference at HF looks large as a result. However – as with previous examples – there is actually very little HF by the time we get to around 15kHz or above. Hence MQA would have little to add beyond the process noise it introduces. So, again, this may mean that any comparison by listening may well hear a ‘difference’ that was actually due to this filtering/‘noise’. Assuming, of course, someone can actually hear these low levels of HF the plots indicate in the first place! If not, the benefit of MQA becomes moot...
2L File: 145
| Type | bits/s | Duration | FFT Span |
| MQA 2L-145_01_stereo | 16 | 307·2933 (54,206,544) | 0 - 300 |
| RBCD 2L-145_01_stereo_01 | 16 | 309·2933 (54,559,344) | 0 - 300 |
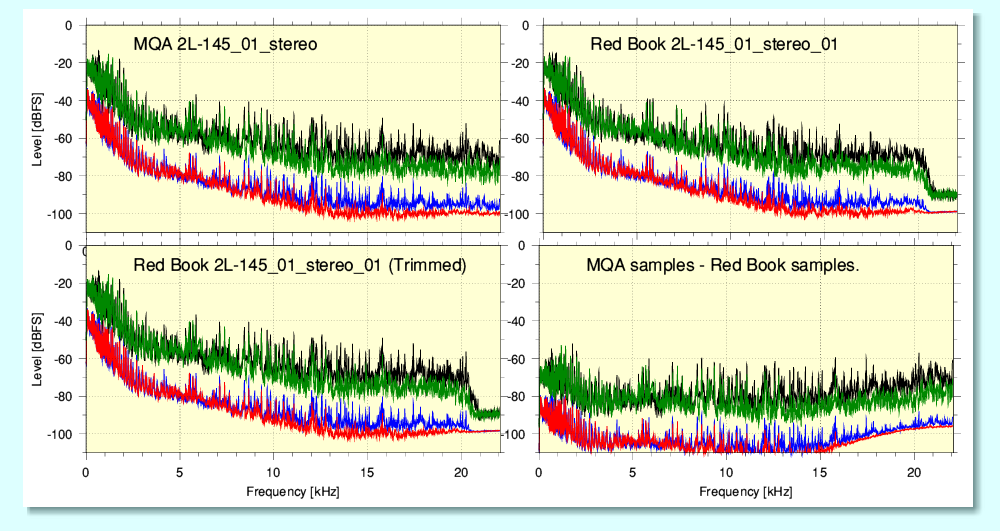
This recording shows more extended HF energy than many of the other 2L examples. However it also shows that the ‘Red Book’ version has had a high-order low-pass filter applied. And, again, the files are of slightly different lengths. Out of curiosity I examined the contents of the two files using Audacity. This showed that the difference in length was actually due to an additional 2 seconds of silence at the start of the ‘Red Book’ version. So out of curiosity I snipped this away to create a ‘trimmed’ version of the Red Book file which was exactly the same length as the MQA example.
The spectrum of the result is – as shown above - unsurprisingly similar the the untrimmed version since it has only lost 2 seconds of almost-silence. However now that the files were matched in duration I was able to generate a sample-by-sample difference file which contains the related values from the MQA file minus the (trimmed) Red Book values. Before doing this I ran a cross-correlation and this showed that the correlation peaked at zero offset between the files. i.e. That their contents were optimally time-aligned.
The above shows the spectrum of this set of sample-differences. Comparing the various spectra above seems to comfirm that the extra ‘noise’ in the region above about 20kHz may be due to MQA. Indeed, it may well be that (almost?) all the ‘noise’ in the difference results is due to MQA. The ‘noise floor’ does appear shaped at HF, but it isn’t clear if this is noise shaping or the deterministic effects of ‘folding’ spectral components, or some other cause. (N.B. A similar HF ‘noise hill’ feature shows up in the 88k2 ‘Golden One’ files so it seems to be characteristic of MQA encoding.)
Overall, the level of the ‘noise’ in the difference between the MQA and non-MQA examples when aligned isn’t as low as we might wish relative to the signal levels. So it is possible that may cause an audible change which affects listening over a large part of the spectrum. This may simply be due to the combination of one version being low-pass filtered and the other having added HF ‘noise’. However the obvious presence of the low-pass filtering in the Red Book version means that the process noise or ‘residual’ might be due to some extra alteration which isn’t itself a part of MQA. As a consequence this result should just currently be regarded as something intriguing which may need further consideration.
Although this page investigates in terms of measured assessments I am also listening to the various files, etc. When I listened to the above sample-differenced file I noticed that the residual content it holds – although at low level – sounds like a ‘tinny’ version of the original. So I checked by considering the difference in spectral levels as being caused by the Red Book version being attenuated and then run though a possibly set of ‘tone controls’ to create a result to add back to the Red Book version and get the MQA version’s spectrum
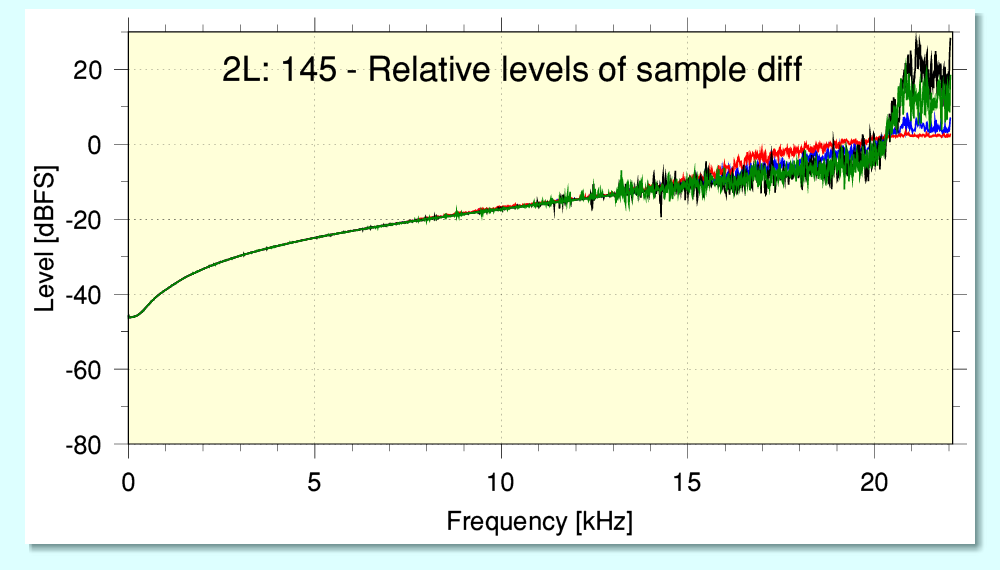
In effect, the above shows the ‘tone control’ shape this would require. One curio here, though, is that the peak levels seem to be affected in a different way than the time-averaged levels. However the implication is that – whatever the cause – that this slightly shifts the tonal balance of the MQA version relative to the Red Book version. It clearly isn’t entirely ‘noise’ hence my use at times of the term ‘process noise’ which is intended to cover alterations that may be audibly deterministic in addition to those that seem to add noise. The deterministic, signal-related nature of the above may make it more noticeable as a change. But as with the other examples, this is combined with other changes like the low-pass filtering. So although it might make one version sound ‘better’ than the other to a given listener, we can’t at this point know if this is due to MQA or some other factor. Hence it underlines the need for care on this point. Once again, a comparison may lead to mistaking some other difference with one caused by MQA.
Given that even the spectral peaks at HF in these Red Book and MQA files remains around or below -60dBFS it seems unclear how much MQA would actually have to do here that is likely to be audible if someone can’t hear a change caused by the low-pass filtering or the alterations in the spectrum. That in turn does raise the question of why the non-MQA versions have been filtered in this way. One possibility is that this was done so that an MQA version could have its encoding suppressed before being issued as non-MQA. An alternative possibility is that it comes from a source file which was used to generate the MQA version because – if I understand correctly – MQA specify that no-one should allow the input version presented to an MQA encoder to be made available. By applying a low-pass filter this can be avoided. Hence it is possible that the low pass filtering is a sign that the non-MQA file is a filtered version of the MQA encoder input. On the other hand it may have been applied for other reasons entirely.
Although many audiophiles may not be aware of the fact, it isn’t that uncommon for digital recordings on Audio CDs to have a low-pass filter applied to reduce their near-Nyquist content. In this respect the 2L files are far from unique! Although this may seem odd or annoying to audiophiles it may lead to better results when the material is played on a system with a poor reconstruction filter. This is because it steers clear of some flaws that can cause anharmonic distortions provoked by components near the Nyquist limit being aliased by a poor reconstruction filter. However as a consequence, this pre-filtering may reduce the ability of a user with a good DAC to tweak the sound by altering their choice of reconstruction filter because the input has been ‘pre-sanitised’! And of course it sacrifices some HF content.
An additional complication here is that the difference between two versions – one low pass filtered and the other with ‘added HF noise’ may have an adverse effect on some types of non-MQA DAC. In particular, many audiophile DACs provide a ‘short’ or ‘narrow’ filter which is aimed at enhancing the temporal resolution of the output. And some audiophiles say they prefer these. However for non-MQA DACs we may then find that:
If the levels of HF are tiny, this won’t matter in audible terms, but also means that MQA is doing nothing useful, either. However if the levels of HF are higher, it may in some cases make the results using the non-MQA DAC sound poorer than it should in normal use. Which can then mean that an MQA DAC’s output would ‘sound better’ because the MQA material is having an adverse effect upon the non-MQA DAC. In effect – albeit unintentionally – it may be fouling the non-MQA DAC without the referee noticing! Again, risking a comparison becoming biassed or unfair.
Overall, the good news for those using non-MQA playback systems is, though, that the 2L examples generally show so little HF that it seems doubtful that the presence/absence of HF would be particularly audible if the Red Book filtering itself is inaudible because the signal levels are so low. The main possible exception above to this generalisation may be 2L file 145 which has more HF, but this is still at a generally low level that may well not be audible if someone doesn’t notice the ‘Red Book’ filtering. Note, though, that the above examples were chosen for analysis at random, so may not fairly represent the behaviour of some other available recordings.
The overall impression however is that MQA in many cases may be similar to the Planet Earth as described by H2G2 being “Mostly Harmless” so far as conventional LPCM replay is concerned – but this may be because in these cases it may also be regarded as, “Mostly Unnecessary”. i.e. It is doing nothing much because there is little or nothing for it to do! However the situation may, of course, be different in other cases where the level of HF is markedly higher. The 2L File 145 above perhaps hints at this, and I hope to investigate the possibility in the near future and present the results on another webpage.
Please also note that I urge others to do similar examinations as there is always the risk that I have made errors or omissions or ‘got the wrong end of the stick’. Hence what I report above should be regarded as provisional and in need of others doing similar work to check if their results conflict with mine or agree with it on the various points. Fortunately, 2L now also offer a wide range of files as raw material - both to enjoy when listening and to investigate and learn from.
Coda
As the files I used for the above examination come from the 2L website I noticed that their webpage which provides the files also offers a link to a document described as “Supplementary listener’s notes from Bob Stuart and Morten Lindberg”. So I fetched a copy and read its content. The file I obtained is 2L-MQA_Comparisons.pdf and the text dates it as ‘Jan 2016’. Note that the files from this site seem to change at times, so it may be useful if you wish to check the following to see if this remains or has been altered or removed.
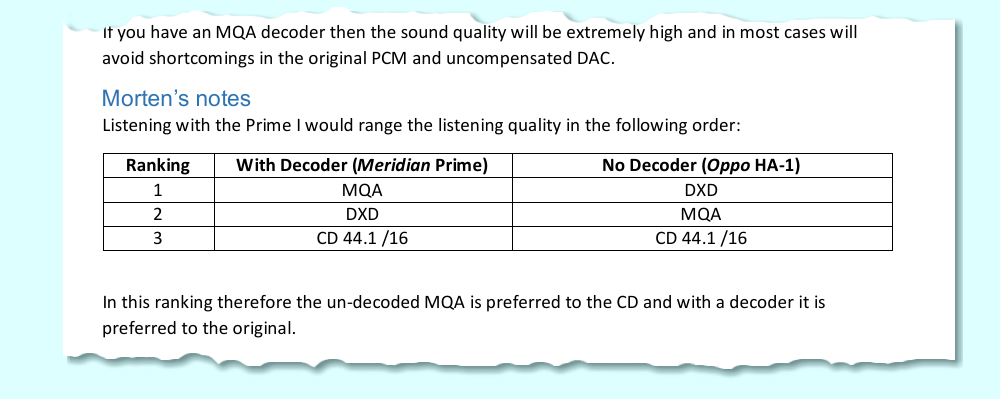
The above shows an excerpt from page 1 of the pdf. The conclusions strike me as being curious given that ‘DXD’ – if I understand correctly – represents the source material from which the other versions are derived. Given that MQA is claimed to ‘Assure’ ‘Master Quality’ how can it sound better than that ‘Master’ when decoded as its designers intend? Should not the required result be that MQA is indistinguishable from the DXD? It being preferred to DXD does seem to imply it is actually acting as an ‘enhancement’ or ‘effect’ rather that being an accurate conveyor of the source material’s audible content. Or do we conclude something was wrong with 2L’s DAC?...
Alternatively, have I misunderstood something here, given that this document has apparently been available for some years? I can understand why someone might prefer MQA without it being decoded to plain Red Book (CD 44·1/16), possibly, for example, because the MQA encoding either alters the content or the Red Book version has been low-pass filtered. But as the bulk of this webpage examples, such a preference may not be because MQA is inherently better, because there are potential confounding factors involved. So these notes do seem curious.
The second page of the pdf mainly shows some graphs of spectra, broadly similar to the ones I have provided. But they do differ in various details so aren’t directly comparable. For example, they use a different number of samples per FFT which changes the apparent levels for a noise floor or wideband signal. However, as with the examples I chose at random, the spectra of music generally show quite low levels of signal power at frequencies around or above 20kHz which implies even smaller levels above this region. Hence they do perhaps also consider examples in the “Mostly Harmless” category.
Two other points seem worth making about what is shown/said on page 2 of the document. Firstly, various ‘noise floor’ spectra are shown, with various shapes. Given this it is worth reminding readers that for conventional LPCM (regardless of if it is encapsulated in a true lossless container like FLAC or as plain LPCM) the spectral distribution of the noise floor depends on the choice and application of standard methods like Noise Shaping. The real fixed quantity here is the total power level of noise. Noise shaping allows you to redistribute this to arrange that the noise level in the regions where it is most audible can be reduced by shifting some noise power to other spectral regions where human hearing is less sensitive. This technique has been routine for well-made Audio CDs for decades. This comment may help those puzzled by the various noise floor shapes shown in the diagrams.
The second point is that showing the noise floor at times when there is no actual music or sound input may not always represent the ‘process noise floor’ when music is being conveyed! The difficulty here is that because the details of MQA aren’t fully open to analysis we need to be aware that it may share a characteristic in common with an older system, NICAM. This also modified LPCM, but by using a ‘block scaled floating point’ approach. This allows it to cover a wider dynamic range for music with a smaller number of bits per sample than standard LPCM. And in practice it has continued to work well for BBC FM distribution for decades. However it does this because its process floor behaviour is essentially ‘masked’ by the technical limitations of Stereo FM broadcasting.
The key point here is that a characteristic of NICAM is that the ‘noise floor’ varies with the signal level. Thus when music is playing the noise level will tend to rise above the value it has when no audio is being conveyed. Given what we know about MQA it seems at least possible that this, also, generates a process noise level that rises with the audio level. Hence in practice the level of alterations it may incur aren’t represented by a noise floor obtained when no music was playing. Unfortunately, given the lack of detail about MQA I can’t say more than raise this possibility. As with NICAM it may pass un-noticed so far as human hearing is concerned. But it does seem like something worth investigating at some point.
All being well I will investigate other aspects of this when the supply of round tuits permit. This page has concentrated on looking at low-rate material provided by 2L. In a later page I intend to bring higher rate material, non-2L examples, and MQA decoding into scope. I may also wonder about the almost philosophical question: “So, what is ‘music’ ?” Answering this question now seems relevant given the claims MQA have apparently been making recently.
Jim Lesurf
5500 Words
29th May 2021
[1] http://www.audiomisc.co.uk/MQA/origami/ThereAndBack.html
[2] http://www.audiomisc.co.uk/MQA/bits/Stacking.html
[3] http://www.audiomisc.co.uk/MQA/cool/bitfreezing.html
[4] http://www.audiomisc.co.uk/HFN/HDCD/Enigma.html
[5] http://www.audiomisc.co.uk/HFN/HDCD/Examined.html
[6] By ‘rendering’ here I mean whatever arrangement the user employs to convert the digital data into an output the rest of their audio system can play. So it may be a DAC or a CD Player, for example.
[8] Here I will use the term ‘process noise’ to mean any additive changes to the audio. These may at times sound and appear like background noise, but may be deterministic and related to the audio signals, so may include distortions or other alterations.