Making Qurious Assumptions?
The standard engineering approach to assessing a new content delivery/transfer system would be to perform a true input - output comparison. i.e. An engineer would feed a set of well-defined input test patterns into the encoder, then feed the encoded results to the decoder and obtain output versions. These could then be compared with the original inputs to determine the details and nature of any changes. This would allow people to assess what impact the encode-decode cycle might have on the audible results. Such a process can involve both listening comparisons and/or technical analysis of the patterns to determine what changes may have been made by passage through the encoding and decoding, and their audibility.
Thus, for example, when the BBC considered switching from using 320k aac to flac for their sound radio streams they did a series of comparisons between the formats both using measurements and listening comparisons. Indeed, others - including myself – were able to participate when they streamed Proms in both flac and aac formats in parallel a few years ago. Alas, with MQA we are, it seems, to a large extent blocked from being able to use this approach, apparently because MQA wish to obscure specific details of their encoding and decoding processes. Instead we are told that it conveys the ‘Master Quality’. In essence: “Trust me, I’m a doctor!”
As discussed on an earlier page[[1]] one person (‘GoldenOne’ or ‘GO’) has managed to get a set of audio files though the MQA encode and decode process and then released their source (input) versions for comparison with the output produced by MQA decoding. Examination of those files does yield some interesting information, but their usefulness is limited because they do represent an extreme case. On an earlier page [[2]] I examined the content of some files provided by the ‘2L’ company, and this also shed some light on the behaviour of MQA. I now want to shift the focus to a different part of the process. But to set the scene for that I want, first, to step back and take a look at the context.
Can you have your kayak and heat it?
The basic assumptions/claims made for MQA include the following:
Upon consideration the boldest of the above claims/beliefs is perhaps the last one as it implies a pattern which is applicable to all possible examples of music, not just what is usual, common, or average. As I understand it, this 1/f presumption was used to rule out the GO files which were said to have essentially ‘over-stressed’ the MQA encoder – Yet the file was initially processed and released without comment. (And the music biz has “form as long as yer arm” when it comes to misuse of many audio processes.)
My initial reaction to this belief was that the 1/f rule may well be true in many cases. But it is also true that ‘on average’ people have less than two legs! So we may need to take some care when assuming all examples of something are ‘average’ or ‘typical’. Thus although a lot of examples of music fit into this straight-jacket, it seems plausible that not every example of recorded music will do so. Hence having many come though MQA audibly unscathed doesn’t offer us a guarantee that other examples may be less fortunate! And without being able to fully test or examine the workings of MQA we can’t easily evaluate in advance if a specific piece of music we may want to hear will be ‘unlucky’. To know, we may need to also hear or examine what went into the MQA encoder – which in general, we may be unable to do. Statistically, though, another point arises when we consider the more basic presumptions about the audible significance of audio components above about 22kHz...
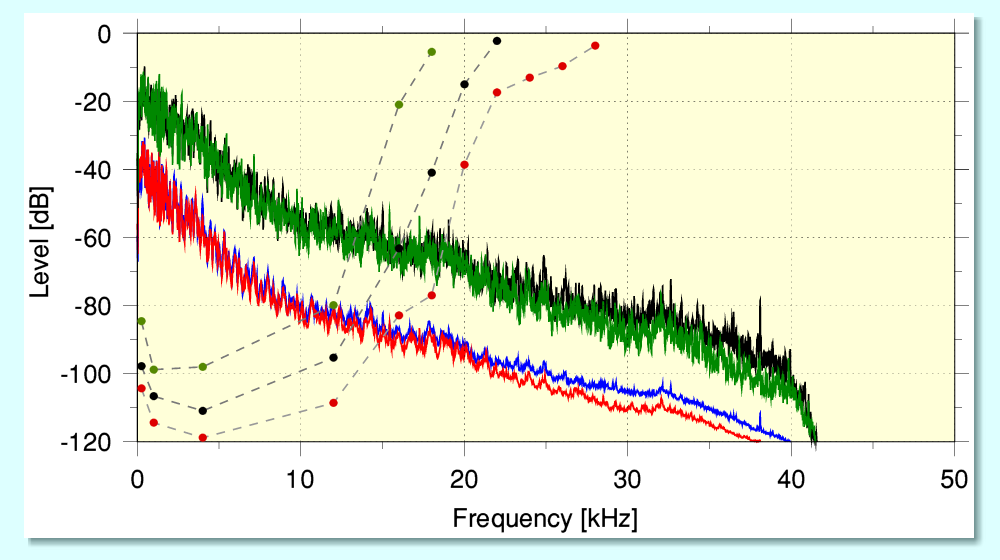
The above graph overlays two sets of results which illustrate a conundrum. The solid red/blue lines show the time-averaged power spectra of a 2L high-resolution file chosen at random. The solid green/black lines show the peak power level at each frequency which occurred at some point during the recording. In essence, the recording can be regarded as fitting into the region up to the green/black lines, and most of the time tends to fit into the region up to the red/blue lines. Looking at these lines we can see that the level does, indeed, tend to fall with frequency, dropping by around 20 to 40 dB for every 10 kHz increase in frequency, with the steepest decline being in the region below 10 kHz. (Ignoring the filtering which seems to occur around 40 kHz.)
The broken lines with coloured points show data taken from a paper on the audibility of high frequencies [[3]]. These require some explanation, but indicate the minimum audio power level required for a tone to to be heard in the presence of some lower frequency pink noise. (i.e. sound with a 1/f form of spectral power distribution.)[[4]] The broken line with black blobs show the overall average result got from the test subjects. The line with red blobs shows the ‘best’ results from 10% of test subjects, and the one with green blobs the results from the ‘worst’ subjects. We can expect that in a small percentage of cases an individual may have ‘better’ hearing than shown here, but it seems clear that for frequencies around 25 kHz the music shows peak levels that are around 60dB lower than would be required to make their presence audible. The implication is that the HF at these frequencies in the music is around a million times too feeble in power to be audible! And as we go to higher frequencies this disparity becomes even more severe.
This, of course, clashes with other papers that make quite different claims about the audibility of sounds well above 20 kHz. However a problem in this area is that many published findings are based upon experimental arrangements that have flaws. For example, note that at these high frequencies the sound level required tends to be quite high for it to become audible. This means that the speaker used to generate the (potentially ultrasonic) test tone may exhibit high levels of distortion. And there are various mechanisms which can then lead to this generating unintended components at lower frequencies – which are more audible! It is also established that for tones well above about 5 kHz human hearing tends to lose the ability to reliably detect pitch. Hence unless a test is done with great care this can mean an unintended distortion product will be audible and gives a false positive result. One of the features of the Ashihara test was the use of pink noise to ‘mask’ such effects. However, by employing this, his procedure also helped to mimic the MQA-assumed 1/f behaviour of music which will normally accompany much weaker components above 20 kHz.
2L and back again
My own view is that the most critical claim about MQA is the one that it is ‘compatible’ with LPCM replay, and that this means that LPCM replay will sound no different than if the provided material were actually plain LPCM, correctly generated. So if someone gets a ‘Red Book’ Audio CD release of a given music recording and an MQA CD release of the same music they should sound the same when played as LPCM, and be as good as possible for 44·1k/16bit LPCM of that source material. If adding the MQA material has any audible impact on LPCM replay the compatibility claim becomes no more than ‘you can still hear music’, which would be little consolation.
The ability to ‘hide’ information about higher frequencies, etc, requires the LPCM format used to have excess channel capacity which can be employed for non-LPCM purposes. Thus when played the hidden MQA contribution simply ‘shuffles the empty deckchairs of noise’ without adding noticeably to the number of them that clutter the LPCM beach!’ For obvious reasons this means that the smaller the total LPCM capacity, the less ‘room to hide’ will be available. Thus the use of MQA with 44·1k/16bit on Audio CD represents the most demanding case. So, here, I decided to concentrate on that type of material. This is critical if MQA ends up being common on Audio CDs. Particularly so if no non-MQA version is available because it suits media companies to ‘single source’ and only make and sell MQA CDs of music you wish to hear via a conventional CD player! With this in mind I therefore looked again at using relevant examples made freely available by 2L.
I was unable to compare these with the MQA encoder input 2L used for the relevant files because these now seem to have been replaced by files produced from the output of an MQA encode-decode cycle. And starting with high rate material like DXD would mean I’d have to downsample that to 88·2k for comparison purposes without knowing if I had done that conversion in a way that exactly replicated what 2L did to feed to their results into an MQA encoder to generate what they put into the nominally-equivalent MQA-CD file. As above, the problem here is not knowing what was actually presented to the MQA encoder because this is not made available. So I decided to take a different approach to see what it might reveal.
The process I adopted was as follows
The tail consisted of three sections. The first is a series of single non-zero impulse functions surrounded by zero-samples. The second is a burst of noise. The third is a sinewave tone to act as a reference level.
The experimental method was to then play each of the above files using an MQA-capable DAC and record the analogue output for analysis and comparison.[[5]] I captured the results using a Benchmark ADC1 running at 88·2k/24. To run these tests I used a Linux laptop and ALSA. This enabled me to check that no alterations were being made by the playout and capture systems in the host computer. The sox-generated 88·2k/24 files were created to encapsulate the audio data in a form that carried the same LPCM information as the 44·1k/16 source files, but would lose the MQA ‘authentication’. These could then be played out via the DAC as 88·2k/24 LPCM, thus matching in rate and depth the output it generated when playing out the MQA-CD equivalent. This meant I could compare how the DAC treated the same material as being LPCM and MQA, both being output and captured as 88·2k/24 LPCM for analysis.
The impulse functions in the tails helped me to determine the relative time-alignments of the MQA source, MQA playback, and (non-MQA) 88·2k captures of each file. They also gave a quick display of the overall impulse response in each case.The noise sections were included to support three purposes. One was to check the overall frequency responses. The second was as a good way to check time-alignement via cross-correlation. The third was to check for distortions due to intersample ‘overs’. The final test tone was to help me set the input gain of the ADC1. Following some initial checks I set this so that the -3dBFS tone in the tails gave -6dBFS on the level PPMs of the ADC1. This was to ensure that the ADC1 did not clip during the main measurements, and hence any clipping distortions observed would stem from the DAC. The full details of the usefulness of the tailed material aren’t all directly relevant to MQA, but were helpful for various experimental reasons. So I’ll only discuss the tail when it seems relevant to the main issue here – MQA.
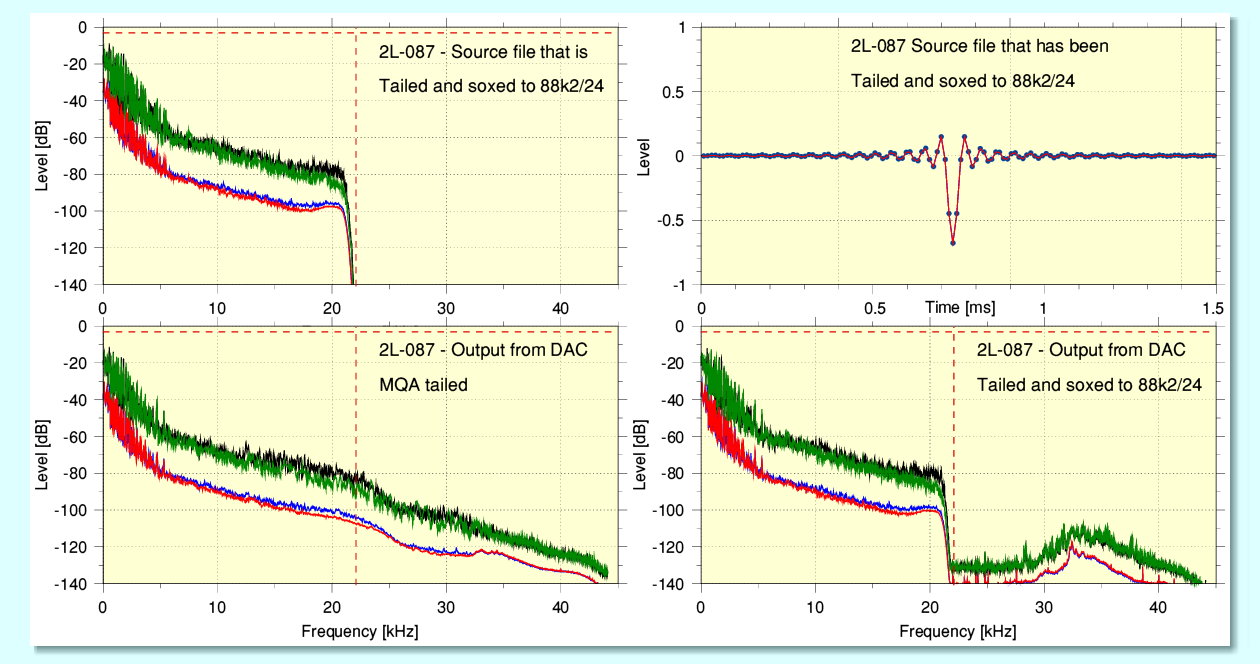
The above illustrates the results using the example of 2L recording 087. Note that all the spectra I show on this webpage were obtained from processing the first 100 seconds of each file’s content. This means the spectra exclude the ‘tail’ and only cover the content of the 2L MQA source files. The broken red lines show the -3dB level and the 22·05kHz Nyquist limit for material at the Audio CD sample rate.
The upper pair of graphs show results from the content of the sox-upsampled 88k2/24 version of the initial 2L MQA-CD file. I used the 88k2 version here as it lets me display the spectrum with the same analysis span and resolution as the spectra obtained from analysing the 88k2/24 captures of the DAC output.) The upper-left spectrum shows that the sox-converted file has – as we’d expect – no content above 22·05kHz because sox treats the original file as pure LPCM at 44k1 rate. The upper-right graph shows the shape of the impulse functions in the tail of the sox-upsampled file. These have the classic ‘sinc’ shape which provides clean conversions.
The lower pair of spectra show the results obtained by recording the output of the Explorer 2 DAC using the Benchmark ADC1 running at 88k2/24. Note that here and in later spectra the -3dB (broken red line) corresponds to the 0dBFS level for the DAC. The lower-left spectrum comes from playing the original MQA-CD (nominally 44k1/16) file and represents what we would obtain when playing the file as a track on an AudioCD via a DAC/player that can decode MQA. You can see that the MQA decoding has produced output above 22·05kHz. When this file was played, the relevant coloured LED did light up to confirm that the Explorer 2 was detecting and decoding the MQA portion of the input.
The bottom-right spectrum was captured when the DAC was used to play the sox-upsampled version of the file. In this case the DAC’s MQA indicator LED did not light, thus confirming that it was not detecting an MQA encoded input. This was what I had intended and meant it treated the input as being plain LPCM. One of my aims here was to have the DAC treat the content below 22·05kHz as being plain LPCM to compare this with it recognising any content as MQA. This helps to arranged that various other possible causes of alterations in the output become ‘common mode’ for both MQA and non-MQA replay.
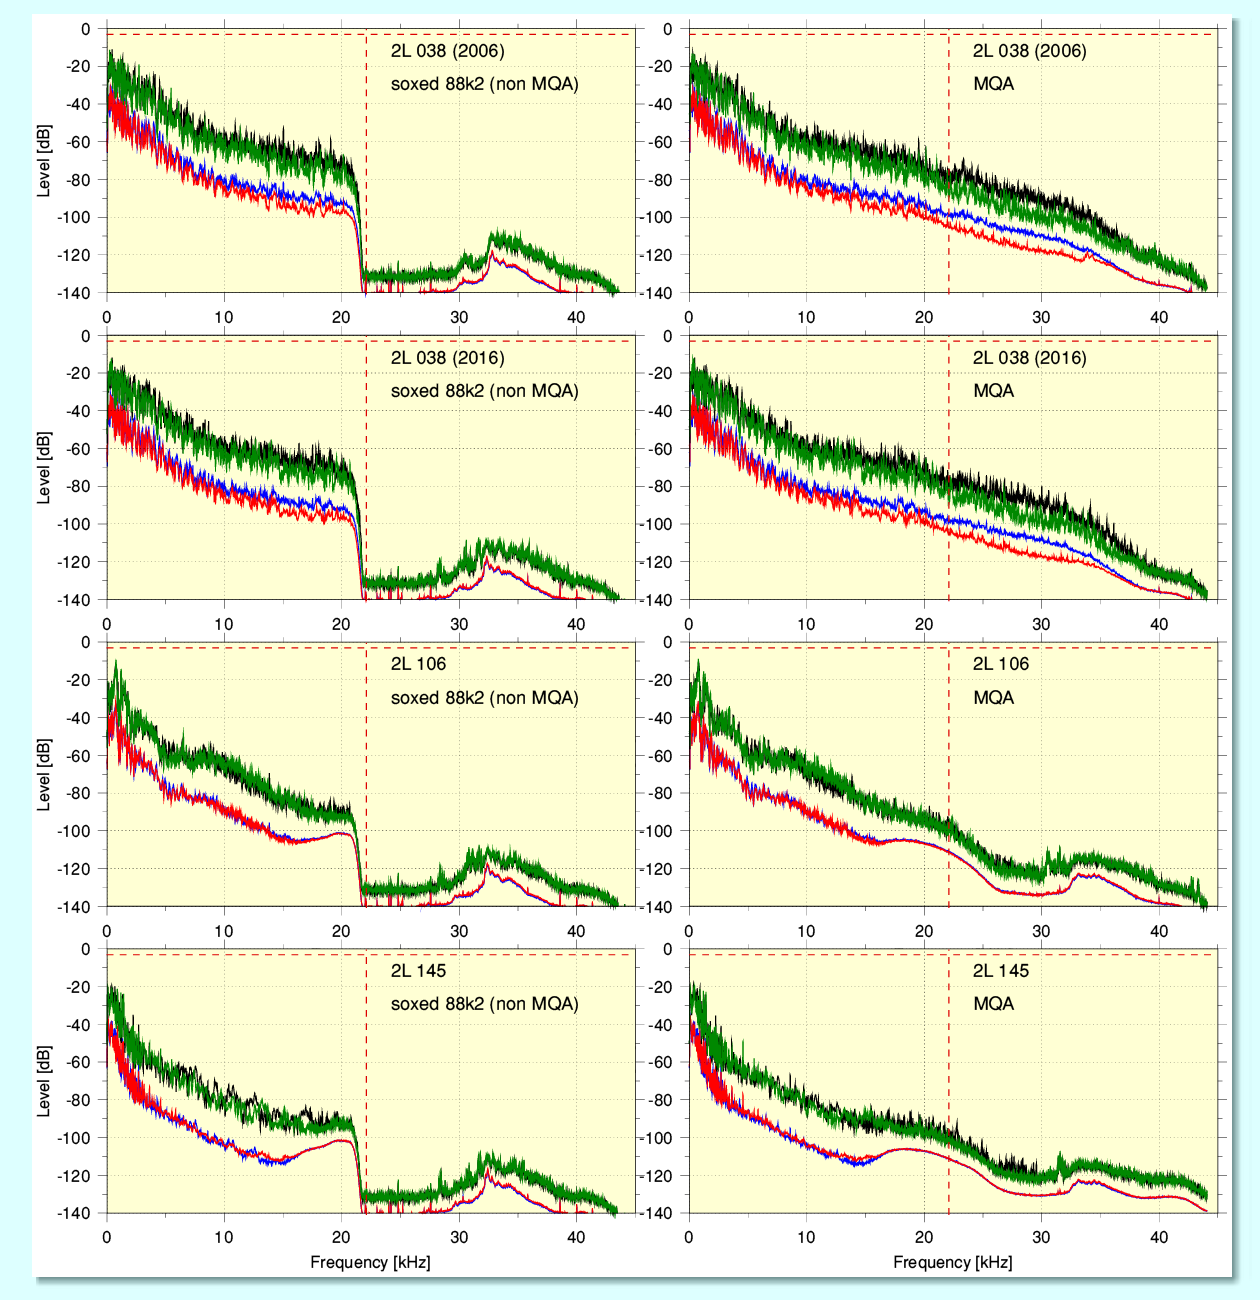
The above shows the equivalent spectra for four other examples of an 2L MQA-CD file. The spectra on the right being the output when the MQA-CD (44k1/16bit as LPCM) file was played out of the Explorer 2 DAC and its MQA indicator lit. The spectra on the left show the output when a sox-upsample to 88k2/24 was played, thus causing the DAC to treat it as plain LPCM, and the MQA indicator did not light up. Comparing the spectra various features can be noticed. The most obvious is that although the DAC treats the sox-upsampled input as plain LPCM it adds a complex set of components above 22·1kHz which are NOT in the source file. (Although not shown here, I checked and confirmed that the sox-upsampled files had NO LPCM content above 22·05kHz.) Thus the added components above 22·05kHz in the non-MQA replay spectra are essentially distortion products. It is hard to be sure from the above, but it also looks like the DAC might also be generating this distortion when decoding and rendering the original MQA input files.
Overall, the behaviour in terms of average spectral shape seems to be that the MQA source file has a ‘bump’ in and around about 20kHz region when considered as LPCM. This is presumably due to the added ‘process noise’ used by MQA to ‘hide’ the higher frequency information it is encoding and storing in the source file. When present it seems to not fall below about the -100dB level at 20kHz. So it becomes more obvious in the spectra when the level of the music is low. What is less clear from these spectra is if or when this bump may become larger when the level of HF to be encoded is higher, although the GoldenOne examples imply that this will tend to occur.
The spectral shape alters when decoded and then seems to fill in the region from about 20 to just over 30kHz. But above this the HF might be as much due to the same distortion process that added HF to the non-MQA replay. i.e. The DAC may generate this by other means. It isn’t clear if this is simply distortion, or if it is deliberate as way to add some HF. The result when decoded tends to show a ‘double hump’ in some cases. And it does look as if the MQA decoding fails to ‘tidy up ’ and remove all the process noise when it decodes the MQA data in the file.
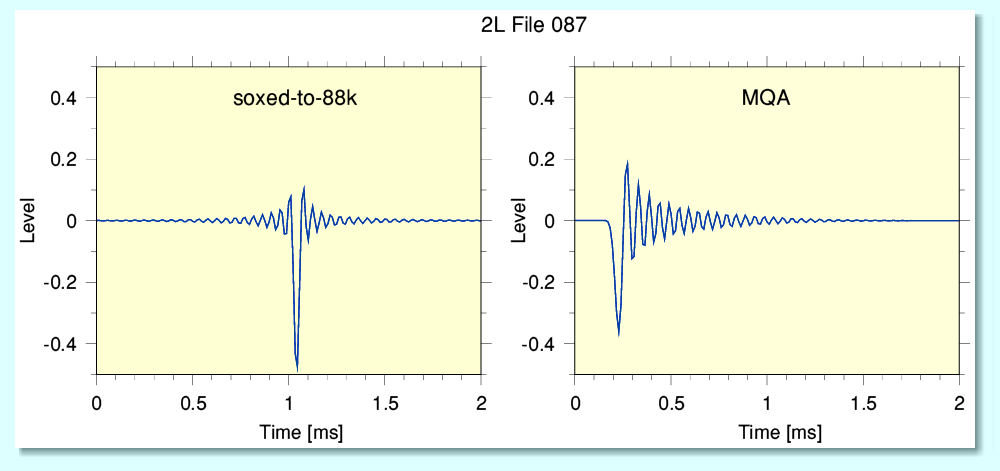
The above compares the impulse functions in the ‘tail’ I added to 2L file 087 as played out by the Explorer 2 DAC. Note that in the soxed-to-88k file sox has converted the single-non-zero impulses in the tail into the standard time-symmetric sinc pattern. This is what we should expect as the file generated by sox has no content above 22·05kHz. The DAC seems to play the resulting impulse functions without altering them a great deal when in non-MQA mode.
However the impulses in the tail of the original MQA file which are then played as MQA show the preference that MQA has for employing a filter that is asymmetric Although these actual tail sections of the files have no MQA ‘authorisation’ patterns the decoder seems to ‘freewheel’ for a time before it disengages and the relevant indicator on the DAC then goes off. This would explain why the the impulse obtained from playing an entirely non-MQA file is so different to playing one which is MQA encoded up until a fraction of a second before the source MQA stream ends and an added ‘tail’ that lacks MQA is played. As a result it seems possible with the Explorer 2 DAC to add short test patterns to the end of an MQA file which are then treated as being in MQA ‘mode’. Similar results were obtained with the other 2L test files I used.
More Questions than Answers?...
MQA nominally operates on the basis of making the encoded information (nominally) inaudible during conventional LPCM reply by processing it into appearing as high frequency ‘noise’ at a modest-to-low level when replayed as part of an LPCM file or CD. That means that there must be a limit to how much ‘ultrasonic’ audio power can be kept inaudible. Taken in isolation various points made may be true in at least some cases, but when we try to apply all of the assumptions made for MQA and add in the assumed nature of hearing, etc, some questions arise.
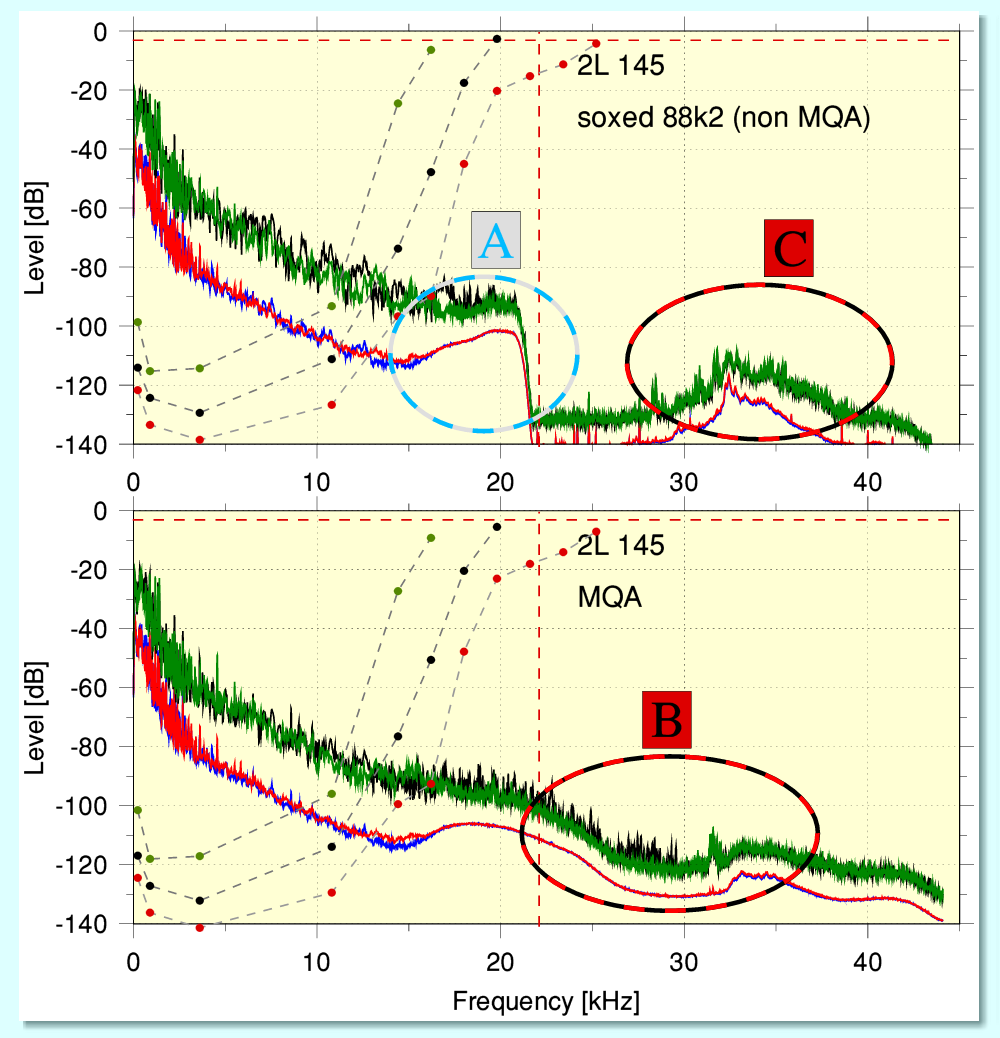
Perhaps the most obvious puzzle is illustrated by the graphs above. These show the spectra obtained from 2L file 145. When playing the MQA-CD source material as plain LPCM the ‘compatibility’ claim requires that the ‘bump’ part of the spectrum (added by the MQA encoded data) ringed as ‘A’ must be inaudible. However for MQA to provide audible material above 22·05kHz we must expect the spectral area ringed as ‘B’ to be audible. (It may also be the case that ‘C’ is inaudible, but that is an issue which may not relate to MQA as such.) The above seems to be a conundrum because the spectral content in ‘A’ is at a higher power level, and a lower frequency, than ‘B’. Hence if ‘B’ is audible we would expect ‘A’ to also be clearly audible.
Given that their power levels are many orders of magnitude below the threashold-of-hearing measurements obtained by careful academic researchers studying human hearing, the simplest resolution of this is to conclude that none of these areas actually have a significant audible effect in normal use. However this does itself include some assumptions. Perhaps the largest of which is that the entire chain of audio equipment is free of confounding/confusing aspects – notably nonlinear distortions. (A factor various reports fail to deal with.) Nonlinear processes at a later stage in the replay chain may mean the HF in the ringed areas give rise to changes at lower frequencies where they may be more audible.
When the encoded material is played as LPCM it tends to show a ‘bump’ in the region around 20kHz. In examples where the level of the musical HF in the 20kHz region is high this bump may not be visible because it is more effectively hidden in the spectral plots. But if the general level around 20kHz is high and the spectrum of ‘music’ remains 1/f then this implies that MQA also needs to encode and hide more information to enable it to recover what existed above 22·05kHz. Which implies this ‘bump’ actually also grows even if it still isn’t noticeable in the spectra. If so, there presumably comes a point when insufficient (information) channel capacity is available for it if the levels are sufficiently high. This also presents a potential conundrum for MQA. If the level of HF above 22·05kHz is high, then it becomes more likely that it will have an audible effect – so it becomes more important that it should be conveyed. But the higher levels of the overall 1/ f spectrum may mean that there may now be insufficient space available. In essence – when you most need an umbrella you may find that the torrential rain has broken it, and it becomes useless!
This clash leads to a concern about the required MQA encoded-alterations affecting non-MQA LPCM replay. As, indeed, clearly happened in the case of the GO files which then needed to be categorised as ‘not music’. Given how large the number of recordings of music of all kinds must be it does raise the question, and the sheer diversity of what people regard as music: how many of them may be classified as ‘not music’ by MQA’s limitations? Or at least sufficiently close to being so as to cause the process noise to become audible, or lead to an inability to encapsulate the HF that MQA is expected to contain without failing the ‘compatibility’ requirement? How would anyone prove the number of such ‘not music’ files was zero?
For obvious reasons this question becomes most significant when MQA is applied to Audio CD format files and discs. 16 bits per sample at 44k1 rate has often been said to be inadequate for the full range of music. This is why, for example, methods like noise shaping have been deployed which shift the required dither noise up to the HF region of the available frequency range to provide an audibly lower noise floor for listeners. This makes use of the decline in audibility as we go to higher frequencies above about 10 - 15kHz... Which is the region that MQA occupies in 44k1/16 material. The snag being that it may require a higher bitrate than conventional noise shaping because it has a data payload to convey in addition to camouflaging itself to seem like ’random noise’ for LPCM replay. Thus it may need to appear at a higher ‘noise’ power level for those who replay the material as LPCM.
A partial argument against the above is to say that because the encoded MQA will have the character of ‘random noise’ when played as LPCM it will be much less audibly noticeable than, say, coherent sets of components that have a simple harmonic relationship with lower frequencies. To some extent this may be true. However a snag here is that it has been established by audiologists that humans tend to lose any sense of specific ‘pitch’ when played tones at high frequencies. In effect, the sensors in our ears then tend to detect the general overall power level at HF. In addition, the presence of many other tones in complex music tend to lead to a result that isn’t simply one set of harmonics. Indeed, many instruments generate overtones that aren’t harmonics of their fundamental frequency.
Even if we accept simple arguments in favour of MQA on these points we still find when we look at the measured results some puzzles. For example, when examining ‘A’, ‘B’, and ‘C’ we can see that although MQA decoding reduces the peak size of the ‘noise hill’ at about 20kHz it does not entirely remove it. Instead it seems to spread this out as a wider, lower ‘bump’ that now covers the region from about 15kHz up to 35 kHz! This is perhaps a consequence of the filtering MQA uses to ‘fold’ information back and forth and/or a failure to remove anharmonic artefacts it generated when encoding. It is difficult to decide because of the secrecy covering details of the MQA process.
Efficiency versus Authority?
Despite the lack of firm information on the details of the MQA-encoded data it seems unlikely that these bumps in the output spectra are a normal feature of the original musical examples, so it looks like they are an artefact of the MQA decoding process not being able to clean up and remove all the packaging in which its HF gift was wrapped in the MQA file. In the 2L results a second ‘bump’ also tends to appear towards the upper end of the expanded spectrum. However this may be due to some other factor as something similar appears with non-MQA playback. So this may be an artefact of other aspects of the operation of the DAC. If so, it isn’t clear at this point if this is intended to aid MQA or for some other reason - intentional or not.
An alternative possibility for the observed behaviour of the ‘bump’ is that it may be more obvious when the musical level is low because it includes the ‘Authorisation’ data that MQA uses to check that the bulk of the material is MQA content which has not been altered since it was encoded. Thus enabling it to determine when to engage the decoder and give the user an indication that this has occurred. I have been told that the MQA system include a regular series of such Authorisation check blocks of data which do this for each section of the stream of data. This is also presumably encoded to appear ‘noise like’ for LPCM replay. However systems of this kind generally lower the efficiency (as defined in Information Theory) of the use made of the communication channel. In effect, they ‘waste bits’ on checking other content rather than devoting them to further content details. And routine checks become a steady source of lost information bandwidth. In this case the result may be that the ‘bump’ has a minimum size that is non-zero to be able to ‘authorise’ sections of the data stream that have only a very small amount of actual audio data. From the spectra this does seem to be the case.
If so, the system become more inefficient when the level of the music is very low, and the bump has maintained a minimum size. Such behaviour is to be expected from the basic requirements of Information Theory. However the curio in this case would be that the bump seems to remain – albeit in slightly different form – in the decoded output. More generally, an authorisation or ‘cross-checking’ scheme used in coding would normally be removed from the decoded output of a communication channel. So either this isn’t done for some odd reason, or can’t be done because the problem is artefacts which have distorted the information as a result of an inefficient (in IT terms) encoding process which loses information, altering the results in a way that isn’t completely reversible from what remains.
The ‘music biz’ has a track record (pun intended!) of often releasing material that has been severely clipped and multiband compressed to be as LOUD as possible because they are convinced this increases sales and that people ‘like’ it. Given this history I can’t help wondering how such examples will fare. Will MQA’s encoder reject them and the relevant company be told that the material isn’t ‘music’ because it overstresses the encoder, so they can’t have an MQA version? How will the company react to this rejection? And if they are right in assuming it is what fans prefer, how might those fans react to being told that what they enjoy is ‘not music’?
A number of other detailed questions and issues arise when MQA becomes a section of the path via which the end-user gets audio. The above sets the background for considering these questions in more detail in a wider context. But to avoid this page becoming considerably longer I will discuss them on another page in due course...
Jim Lesurf
5100 Words
29th Jun 2021
[1] http://www.audiomisc.co.uk/MQA/GoldenOne/ChallengeAndResponse.html
[2] http://www.audiomisc.co.uk/MQA/investigated/MostlyQuiteHarmless.html
[3] https://asa.scitation.org/doi/10.1121/1.2761883
[4] Note for mathematicians: The use of the 1/f description here often tends to be a bit vague! In general it seems to get used to describe an overall general tendency for the log of the power level to fall linearly as the frequency rises. But the power-law, etc, may vary.
[5] I’d like to thank March Audio for providing me with a Meridian Explorer 2 MQA DAC for these tests.